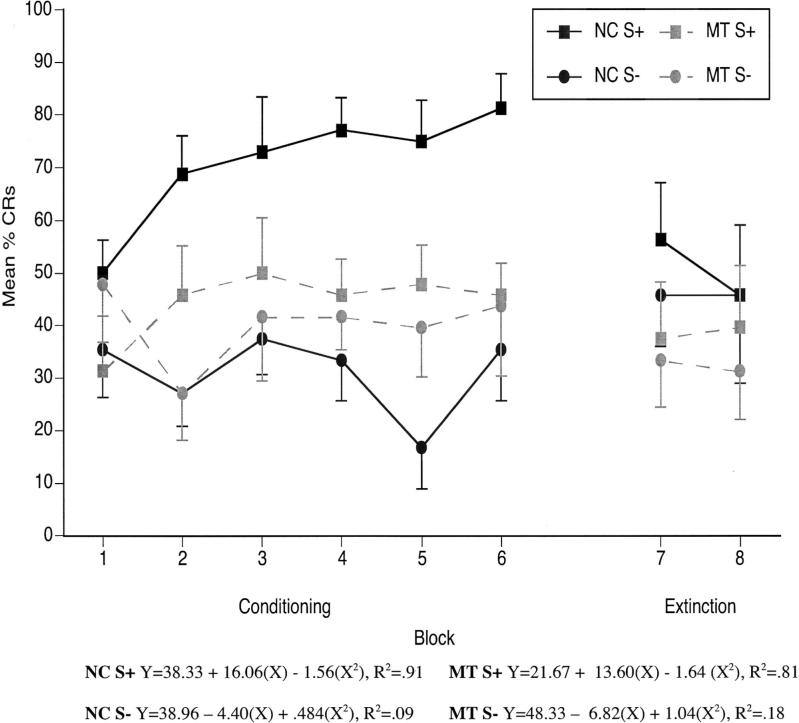
Figure 7.
Delay conditional discrimination learning curves showing mean (± SEM) percent conditioned responses (CRs) from six blocks of six reinforced trials, six blocks of six nonreinforced trials, and two blocks of six extinction trials. Quadratic regression analyses were performed for the mean percentage of CRs for each group separately for the six blocks of acquisition trials. NC = normal control participants; MT = medial temporal lobe amnesic patients; S+ = reinforced stimulus; S− = nonreinforced stimulus.

