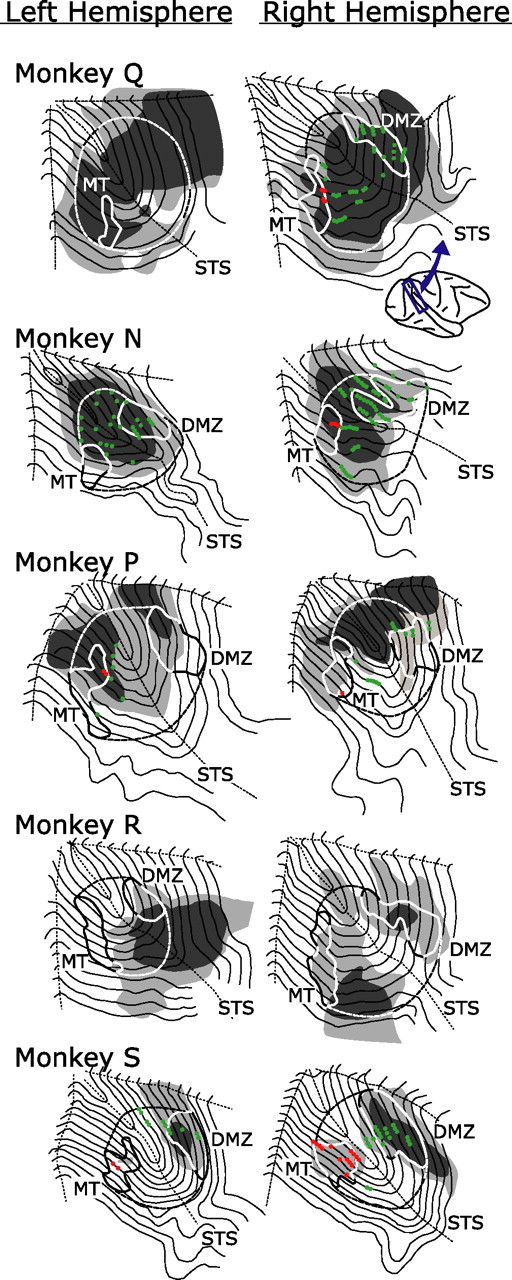
Figure 1.

Two-dimensional maps of the STS in 10 hemispheres of five monkeys reconstructed from parasagittal sections using the method of Van Essen and Maunsell (1980). The maps of the left hemisphere are left–right reversed to facilitate easy comparison with the maps of the right hemisphere. The inset shows a view of the right hemisphere with the general area of the STS indicated. Contour lines depict the unfolded layer IV. Solid boundary lines delineate the densely myelinated zones in the anterior bank (DMZ) and the posterior bank (MT) of the STS. Dashed lines depict the approximate medial and lateral boundaries of the MST, which is subdivided into MSTd anteriorly and MSTl posteriorly by the dotted lines depicting the floor of the STS. Black shading indicates areas with morphological damage extending through all layers of the cortex (complete lesion), and gray shading indicates areas with damage to some but not all cortical layers (partial lesions). Circles indicate the approximate recording sites of neurons that responded to visual motion and showed directional selectivity (red, MT neurons; green, MST neurons).
