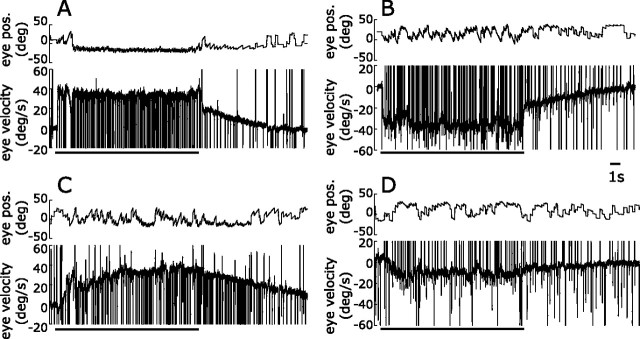
Figure 10.
Deficits in the optokinetic responses after ibotenic acid injections: sample temporal profiles (monkey P). A, B, Data obtained before the injections. C, D, Data obtained after the injections. In each panel, the top traces show horizontal eye position (eye pos.; in degrees), and the bottom traces show horizontal eye velocity (in degrees per second) over time (in milliseconds) in response to rightward (A, C) and leftward (B, D) motion of a random-dot pattern at 40°/s. Upward deflections denote eye movements in the direction of stimulus motion. Thick lines indicate the duration of the illumination of the already-moving random-dot pattern.

