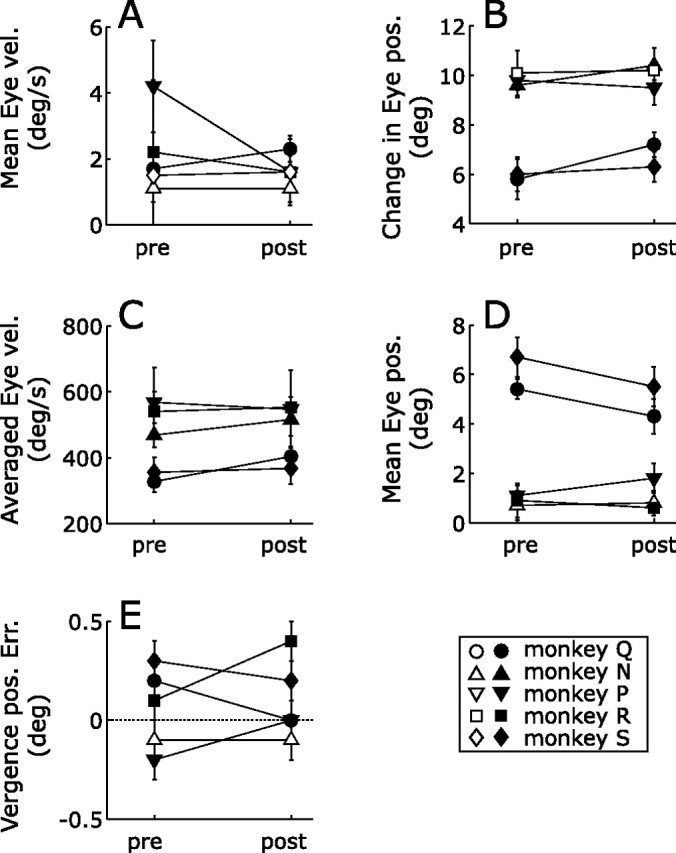
Figure 12.

General oculomotor characteristics before (pre) and after (post) ibotenic acid injections. A, Mean ocular drift during the 50-ms period commencing with the onset of the visual stimulus; values are mean drift speeds in degrees per second (±1 SD) of the velocity vector. B, Mean amplitude of the leftward-centering saccades in degrees (±1 SD). C, Mean peak velocity of the leftward-centering saccades in degrees per second (±1 SD). D, Mean eccentricity of gaze in degrees (±1 SD) in the OFR paradigm during the 50 ms period commencing with the onset of the visual stimulus. E, Mean vergence error in degrees (±1 SD) in the RFVR paradigm during the 50 ms period commencing with the onset of the visual stimulus; a positive sign indicates overconvergence. Filled symbols denote that the differences between the means before and after the injections were statistically significant at the 0.05 level (Student's t test). vel., Velocity; pos., position; Err., error.
