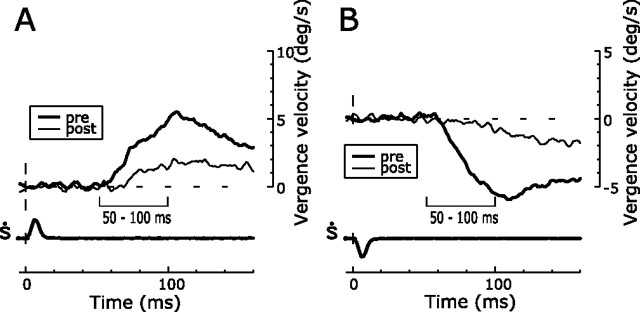
Figure 6.
Deficits in DVRs after ibotenic acid injections: sample temporal profiles (monkey Q). Mean vergence velocity (in degrees per second) over time (in milliseconds) in response to multiple presentations of 1° crossed (A) and uncrossed (B) disparity steps before (pre; thick traces) and after (post; thin traces) the injections. Disparity steps were applied at zero on the time scale. Upward deflections denote convergent eye movements. The time bars, 50–100 ms, indicate the period over which the response measures were made.

