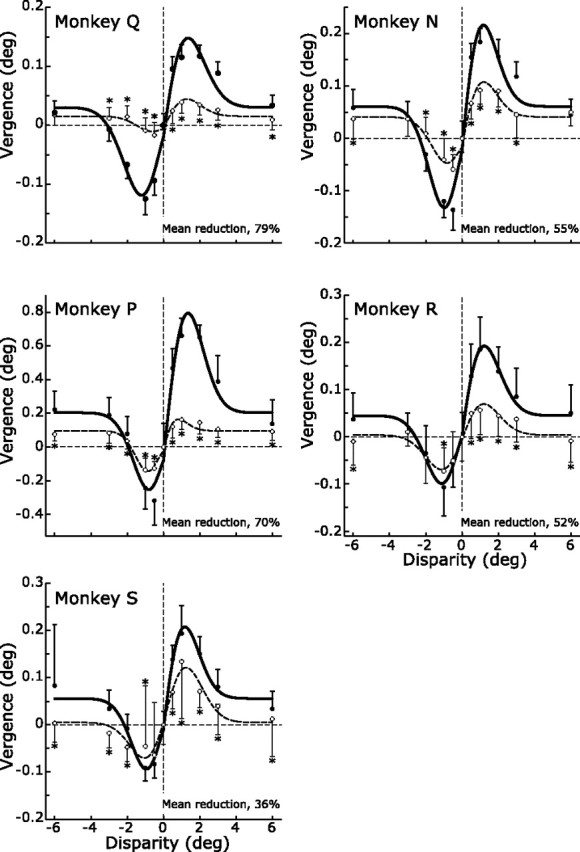
Figure 7.

Deficits in DVRs after ibotenic acid injections: disparity tuning curves (data for each of the five monkeys). Ordinates, Vergence responses, based on the mean changes in horizontal vergence position (in degrees; over the time period 50–100 ms measured from onset of the disparity step) before (closed symbols) and after (open symbols) the injections. Abscissas, Disparity step (in degrees). Curves are the least-squares best fits obtained using Equation 1, and the data given at the bottom right in each panel are the mean percentage reductions in Ap-p (peak-to-peak amplitude) based on values in Table 3. Error bars indicate 1 SD. *p < 0.05, postinjection data.
