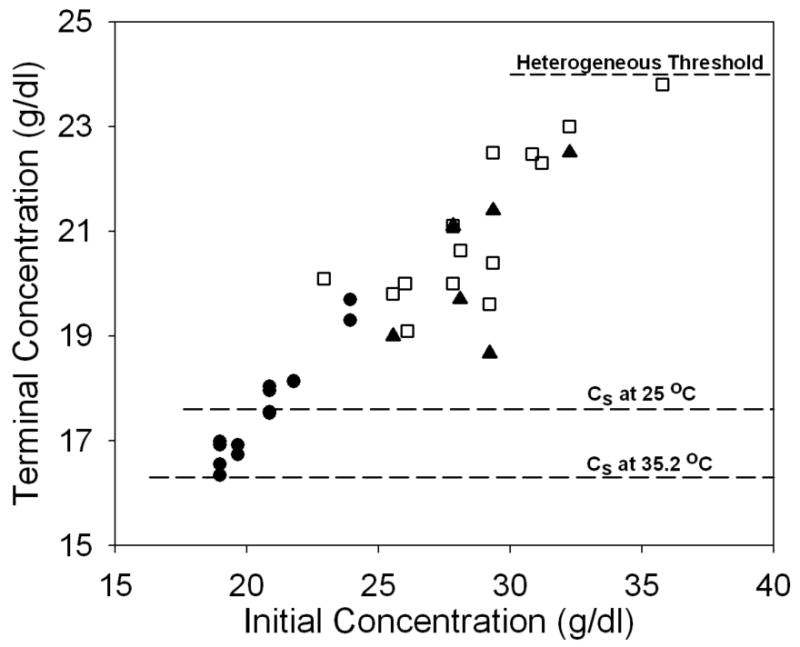
FIGURE 1.

The dependence of terminal concentration on initial sample concentration. Filled circles are results from modulated excitation measurements at 35.2° C; filled triangles (35°C) and open squares (25°C) are based on the reservoir method. The dashed lines refer to the sedimentation solubility at 35.2°C and 25°C respectively1. The final solution concentration increases with increasing initial concentration regardless of which methods adopted. However, all terminal concentrations are below the heterogeneous threshold, below which heterogeneous nucleation practically shuts off (shown as the dashed line, ∼24 g/dl). Also noticeable is when initial concentration decreases, the final solution concentration approaches sedimentation solubility.
