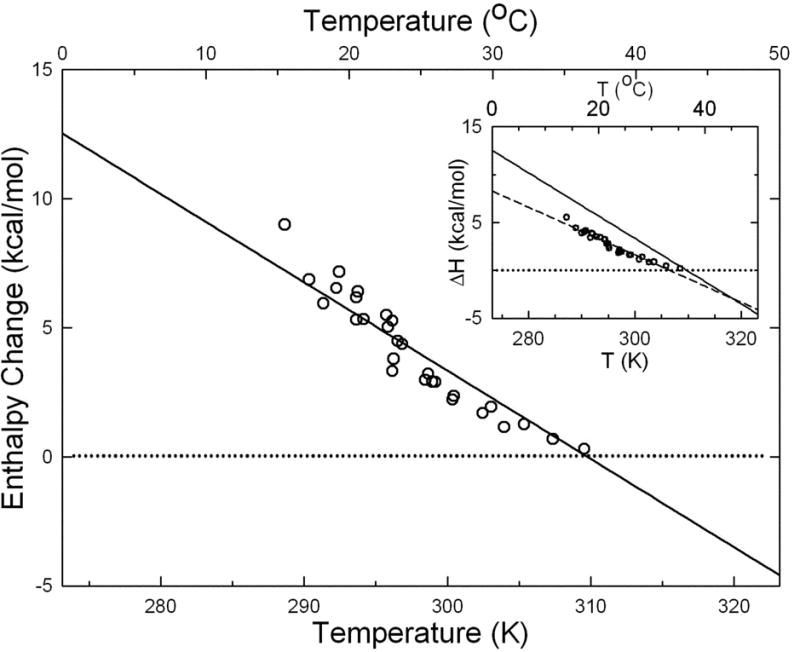
Figure 4.

Enthalpy vs. Temperature for gels of HbS. The data is that of Ross et al.1; the inset shows the analysis of Eaton and Hofrichter13. The solid line is derived from the van't Hoff enthalpy based on the temperature dependence of the solubility. The points are from calorimetry, analyzed as in the text in accord with the observations of metastable polymerization. As seen in the major figure, the calorimetry and van't Hoff analysis agree, whereas when complete polymerization was assumed, as in the inset, the disagreement was significiant. The dashed line in the inset is simply a best fit to those points.
