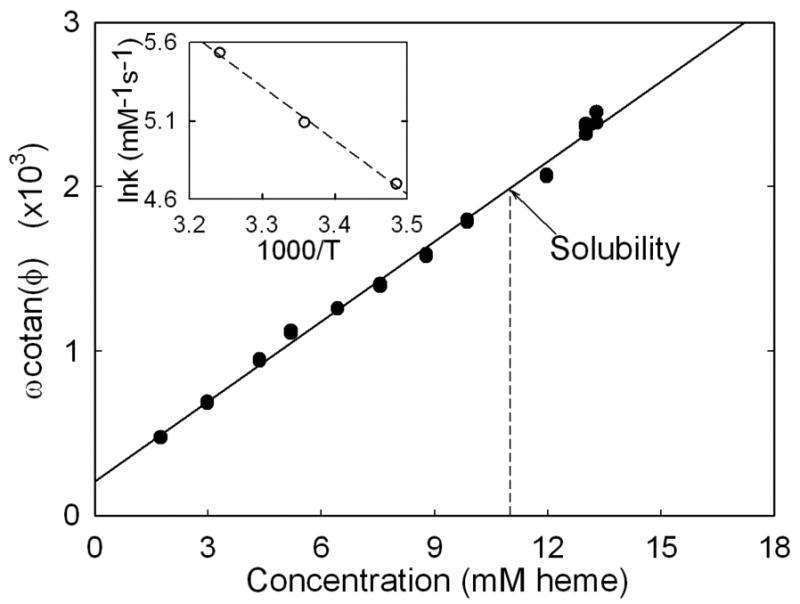
FIGURE 6.

Phase angle shift: ω cotan φ is plotted as a function of sample concentration for unpolymerized HbS. ω is the angular frequency, related to f by ω = 2πf. For each experiment, ω and φ were varied with the goal of keeping φ near π/4. The data is expected to be linear from Eq. 1. The T state binding rate kT is the slope of the line, and aI is its intercept. We find kT = 162 mM-1s-1, and aI = 209 s-1. A series of samples were required for this calibration experiment whose concentrations were determined by dilution and measuring their Soret band absorption spectra. It is possible to measure these samples above the solubility because of the long delay time for those concentrations. The inset shows the natural log of the rate constant, determined as the slope, as a function of reciprocal temperature. The activation energy is determined from the slope of the inset, and is 9.6 kcal/mol.
