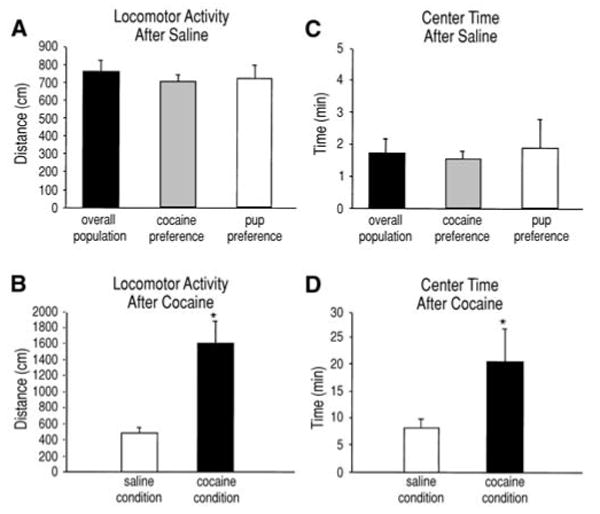
Fig. 3A–D.

These graphs show two aspects of locomotor activity for both the total population (n=27) and the dams separated by preference for a stimulus-associated chamber. Mean (±SEM) horizontal distance traveled after (A) saline administration and (B) cocaine administration (n=9). Mean (±SEM) time spent in the center after (C) saline administration (n=27) and (D) cocaine administration (n=9). There were no differences between preference subsets, but there was a significant increase in locomotor activity after cocaine administration. Asterisk indicates a significant difference from the saline condition, P<0.05
