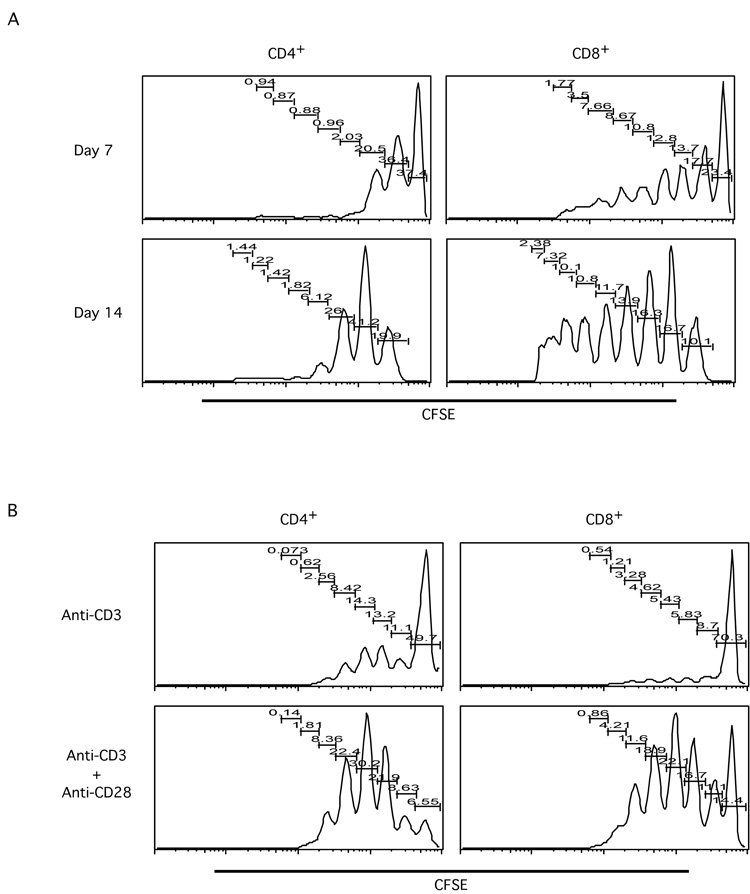
Figure 1. Differential behavior of CD4+ and CD8+ T cells undergoing homeostatic proliferation.
Total T cells were purified from lymph nodes (LN) of BALB/c mice by MACS; purified T cells were then labeled with CFSE.
A. Labeled T cells were transferred into sub-lethally irradiated BALB/c mice. Seven and fourteen days later, transferred cells were analyzed by flow cytometry. Histograms show the CFSE profiles of transferred T cells in the CD4+ and CD8+ subsets at day seven and day fourteen time points. Data shown are recovered cells from one representative recipient animal at each time point.
B. Labeled T cells were cultured with anti-CD3 or anti-CD3 plus anti-CD28 coated beads for three days. Cultured cells were then stained for CD4 and CD8, and subjected to FACS analysis. Histograms show CFSE profiles of gated CD4+ or CD8+ cells under different stimulation conditions. Data shown are representatives of three independent experiments.

