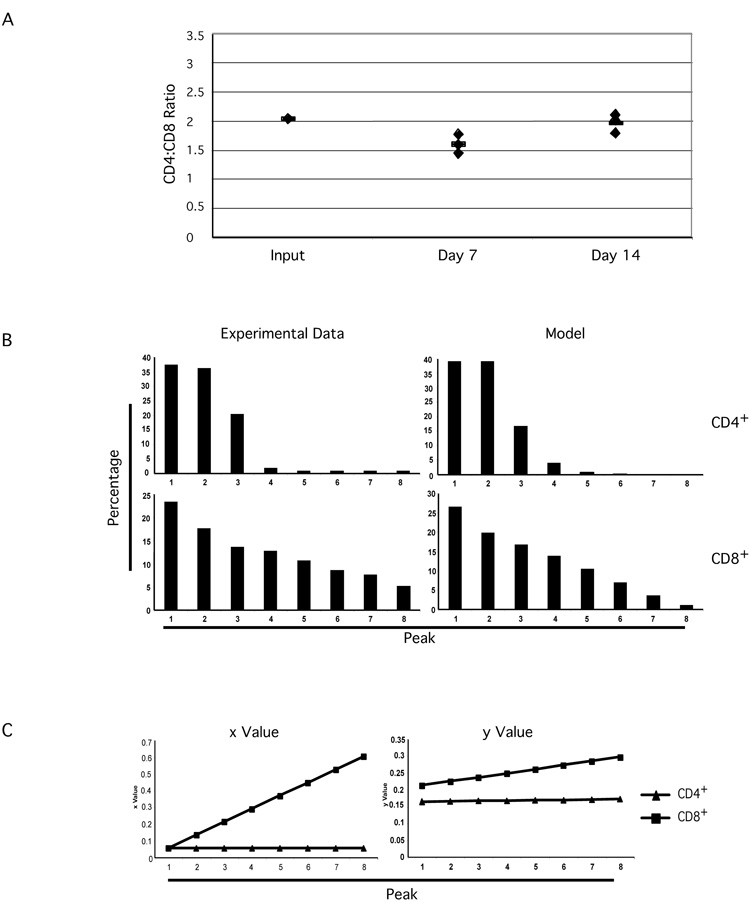
Figure 3. Differential T cell behavior of CD4+ and CD8+ subsets in homeostatic proliferation.
T cell purification, CFSE labeling, and adoptive transfer were performed as in Figure 1A.
A. CD4+ vs CD8+ ratios were calculated for purified total T cells from BALB/c lymph nodes (Input), recovered CFSE positive T cells at day seven and day fourteen after adoptive transfer, respectively.
B. The percentage of each peak in CFSE profiles was calculated. These numbers were used to calculate the x and y parameters for CD4+ and CD8+ T cells as described in Materials and Methods and in the text. The calculated parameters, x (the proportion of dividing cells) and y (the proportion of dying cells), were used to build models simulating the peaks in CFSE dilution profiles. Graph shows the comparison between experimental data (at left) and model results (at right).
C. The x (the proportion of dividing cells) and y (the proportion of dying cells) parameters were calculated as described in Materials and Methods and in the text. Graphs show the comparisons of x and y parameters for CD4+ and CD8+ T cell subsets under homeostatic proliferation.

