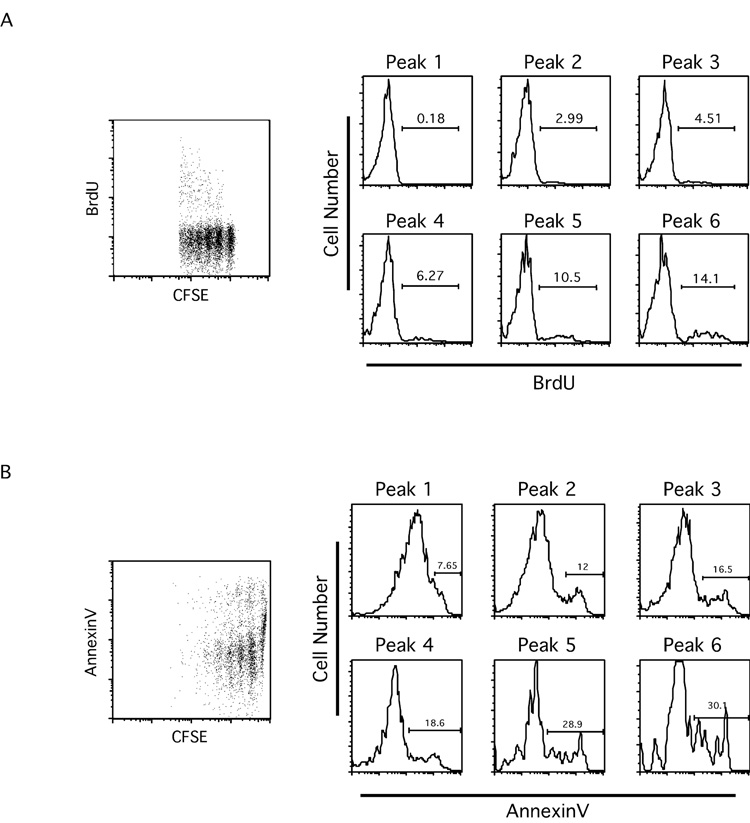
Figure 4. With each successive division, both the proportion of cells entering cell cycle and the proportion of cells undergoing apoptosis increase.
T cell purification, labeling and adoptive transfer were performed as in Figure 1A. One day before organ harvest, mice were injected i.p. with BrdU (2mg/mouse). BrdU staining (A) and AnnexinV staining (B) were performed as described in Materials and Methods.
A. Dot plot showing BrdU vs CFSE profiles from transferred CD8+ T cells. Histograms show BrdU staining for each CFSE peak.
B. Dot plot showing AnnexinV vs CFSE profiles from transferred CD8+ T cells. Histograms show AnnexinV staining for each CFSE peak. Data shown are representative of five mice from two experiments.

