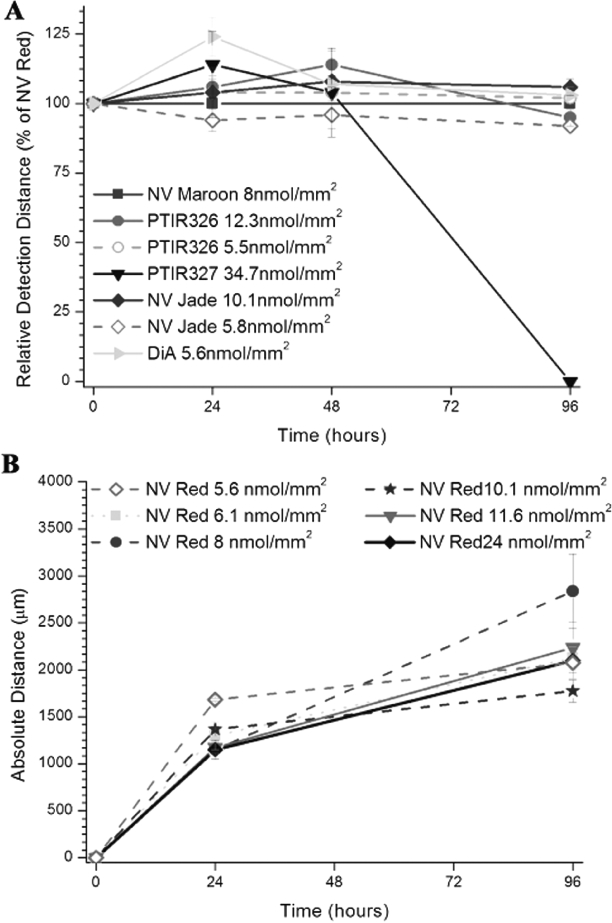
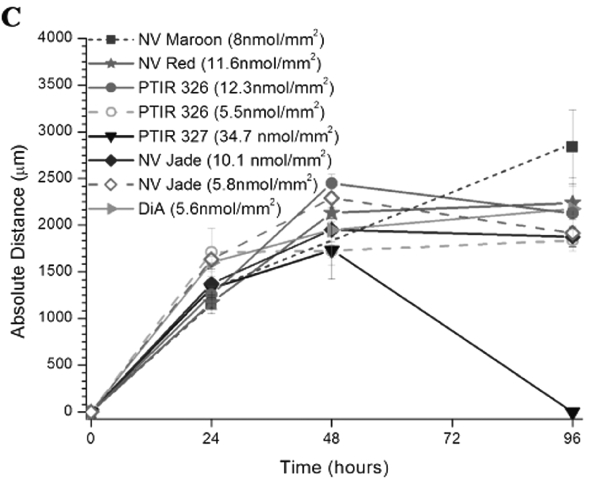
Figure 3.


Relative and maximum detection distances for NV Maroon and Candidate green dyes in murine spinal Cord assay. Relative detection distance (RDD) and maximum detection distance (MDD) were Calculated as described in Figure 2 for nylon filters Co-loaded with the indicated levels of the listed dyes. Mean±SE is plotted for each time point, with the exception that only one of three samples was quantified at 96h for PTIR 327 (inverted triangle). Co-loading levels for NV Red and test dyes are shown in Table 4. Panel A: Within-replicate variability was significantly lower for RDD than MDD (Panels B and C) since ratiometric analysis reduces variability due to tissue-related factors such as differences in fixation time and Crosslinking. No significant differences in RDD values were observed across the different loading Concentrations for all tested dyes, including PTIR327, at 24 and 48h (F(6,15) = 1.83, p = 0.16, n.s.; F(6,17) = 0.76, p = 0.6, n.s.; respectively by single factor ANOVA). When PTIR327 was excluded, a marginally significant difference was noted for the remaining dyes (F(6,12) = 3.05, p = 0.047). However, it was attributable to an atypically low variance for the NV Jade triplicates at 5.8 nmol/mm2 loading and therefore must be Cautiously interpreted. Panel B: MDD values for NV Red increased at approximately 1 mm/day for the first 48h and then stabilized, presumably due to Complete filling of the relatively short neuronal profiles in neonatal spinal Cords. No dose-response effect was seen for different loading levels, which varied more than 4-fold.Panel C: MDD values for test dyes exhibited Comparable kinetics of profile filling to NV Red (again with the exception of PTIR 327) and were minimally affected by differences in loading level. No significant differences in MDD values were observed across the different loading Concentrations for all tested dyes at any time point.
