Figure 5.


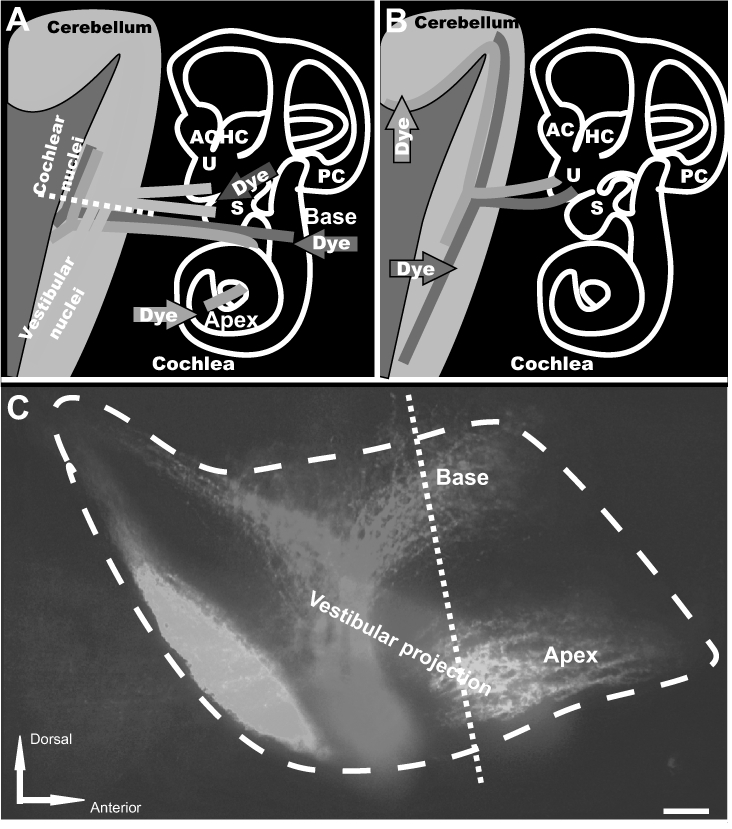
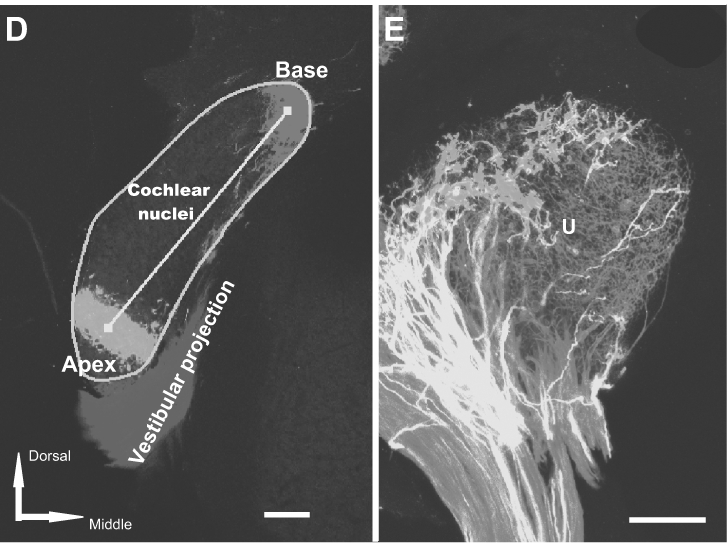
Three-color neurotracing with NV Jade, Red, and Maroon allows easy visualization of nerve fibers projecting from ear to brain or brain to ear by either epifluorescence or confocal microscopy. Nerve tracts originating at discrete locations in the periphery and projecting into closely adjacent regions in the brain of E18.5 mice (A, C, D) or nerve tracts arising in the brain and innervating the inner ear (B, E) were imaged using NV Jade (green pseudocolor) in combination with NV Red (red pseudocolor) and/or NV Maroon (blue pseudocolor) after 5 days of diffusion at 37°C Scale bar indicates 100 μm in all images. Abbreviations: AC, anterior crista; HC, horizontal crista; PC, posterior crista; S, saccule; U, utricle. Panel A: schematically illustrates the location of dye insertions in the inner ear (colored arrows) and the nerve fibers projecting from those locations back to the brain (colored lines), and in particular into the cochlear nuclei (red, green) and vestibular nuclei and cerebellum (blue). Epifluorescence of whole mounted brain and confocal images taken from tissue section shown by the white dotted line are shown in panel C (lateral view) and panel D (section along the dotted line shown in C), respectively. Panel B: shows insertion points in the brain (red and green arrows) used to fill nerve fibers projecting to the utricle (U), a vestibular endorgan in the inner ear. The corresponding confocal image is shown in panel E. Panel C: Nerve fibers originating from the base or apex of the cochlea or the central vestibule of the inner ear were labeled by insertion of filter segments coated with NV Jade, NV Red or NV Maroon, respectively. Epifluorescence imaging of a whole brain mount using standard FITC, Texas Red and Cy5 filters, respectively, showed excellent color segregation of the corresponding closely adjacent projection areas in the brain (cochlear nuclei and vestibular projection area). Image shown was corrected for bleed through in the Cy5 channel from regions having high intensity NV Red signal using Image Pro (see Materials and Methods). Dashed line indicates the level of the coronal section cut from the same preparation and imaged by confocal microscopy (panel D). Neuronal profile filling was detectable at distances of up to 5 mm away from the filter insertion sites. Panel D: A coronal 100 μm thick vibratome section cut along the dashed white line shown in panel A and imaged by confocal microscopy clearly shows the expected discrete projections from the inner ear into the cochlear and vestibular nuclei in the brain without any bleed-through. Using such projections, it is possible to determine the area of the cochlear nuclei (turquoise line), distances between projection bands (yellow line) or absence of overlap of specific projections in normal mice and assess how each is affected by specific mutations. Panel E: Insertion of NV Jade and NV Red filter segments into the cerebellum and the brainstem, respectively, of fixed neonatal mouse brain followed by confocal imaging of whole organ mount allows detailed visualization of segregation (green, red) or overlap (yellow) of innervating fibers within specific endorgans such as the utricle (U) of the inner ear, using a much simplified protocol compared to that require for neurotracing of the same tissue with DiA and DiI (see text).
