
Figure 1.
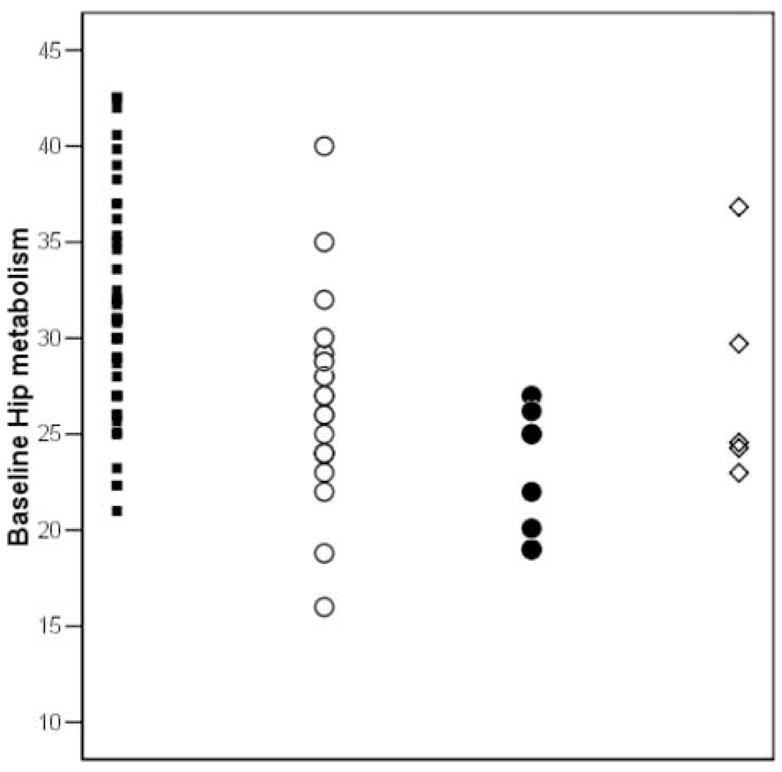
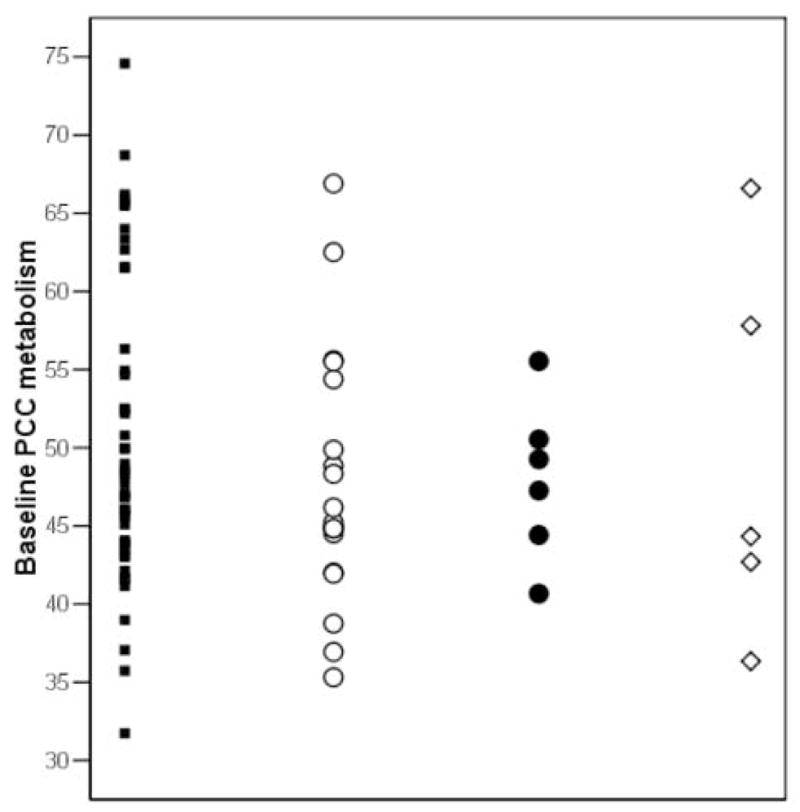
Pons-adjusted baseline hippocampal (Hip) and posterior cingulate cortex (PCC) glucose metabolism (μmol/g/min) by outcome group. Symbols: NL-NL (black squares), NL-MCI (white circles), NL-AD (black circles), and NL-non AD (white diamonds).
Official websites use .gov
A
.gov website belongs to an official
government organization in the United States.
Secure .gov websites use HTTPS
A lock (
) or https:// means you've safely
connected to the .gov website. Share sensitive
information only on official, secure websites.
Pons-adjusted baseline hippocampal (Hip) and posterior cingulate cortex (PCC) glucose metabolism (μmol/g/min) by outcome group. Symbols: NL-NL (black squares), NL-MCI (white circles), NL-AD (black circles), and NL-non AD (white diamonds).