
Figure 3.
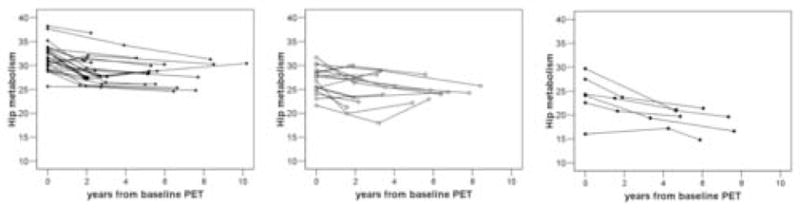
Individual trajectories of Hip glucose metabolism (μmol/g/min, pons-adjusted, atrophy corrected values) derived from the mixed effects model are plotted relative to the time of the first PET examination for NL-NL (black squares), NL-MCI (white circles), and NL-AD (black circles).