
Figure 4.
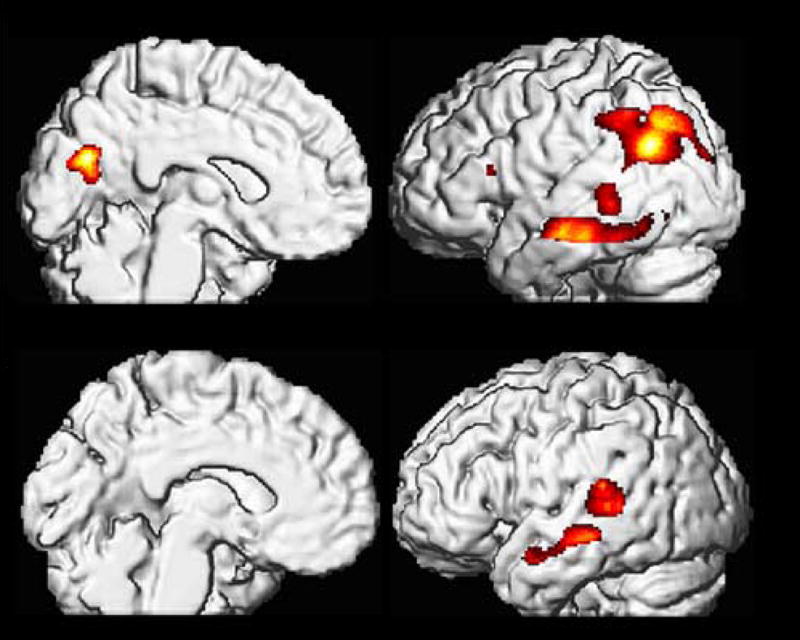
Cortical MRglc reductions in NL-AD (Upper half) and NL-MCI (Lower half) at the time of decline relative to NL-NL. Areas of hypometabolism relative to NL-NL (represented on a red to yellow color coded scale) are displayed onto the left medial and left lateral views of a volume-rendered spatially normalized MRI image.