
Figure 5.
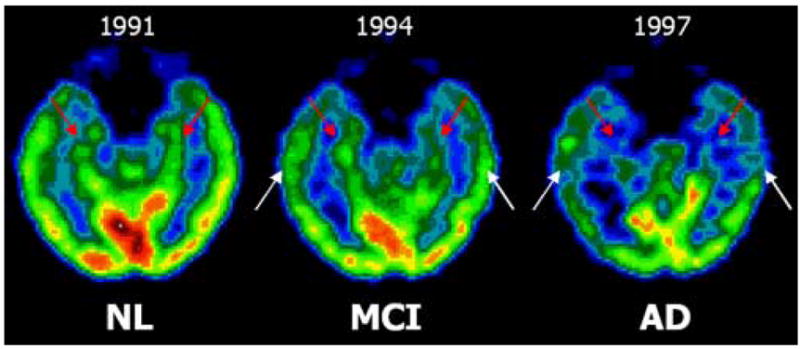
Longitudinal FDG-PET scans of one subject (female, baseline age: 73 years, education: 12 years, baseline MMSE: 30/30) that declined from NL (in 1991) to MCI (1994), and then to AD (1997), and had the AD diagnosis confirmed at post-mortem (2000). Axial mages are displayed in a negative-angulation running parallel to the hippocampal plane. The scans show progressive hippocampal (red arrows) and temporal cortex (white arrows) metabolic reductions.