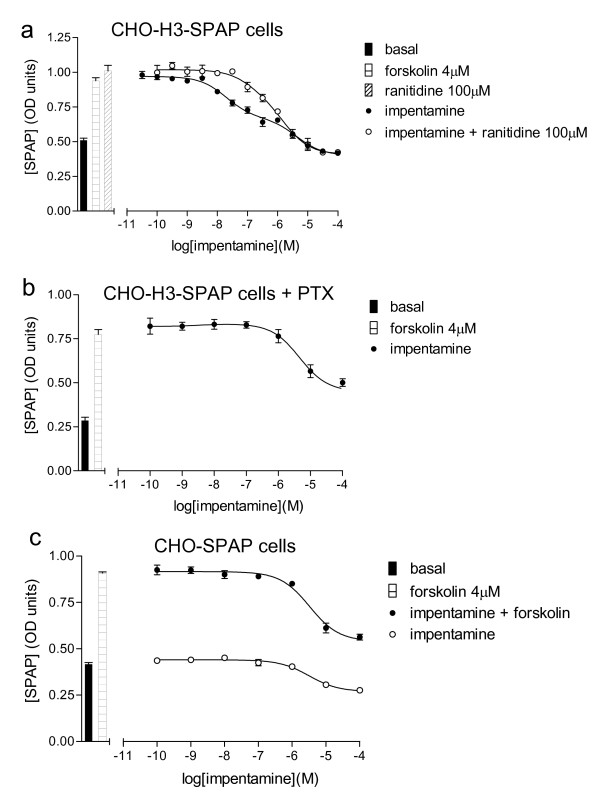
Figure 6.
a) CRE-SPAP production in forskolin-stimulated CHO-H3-SPAP cells in response to impentamine in the absence and presence of 100 μM ranitidine. Bars show basal CRE-SPAP production, that in response to 4 μM forskolin alone and to 100 μM ranitidine in the presence of 4 μM forskolin. b) CRE-SPAP production in forskolin-stimulated CHO-H3-SPAP cells in response to impentamine following 24 hours pre-incubation with PTX. Bars show basal CRE-SPAP production, that in response to 4 μM forskolin alone following pre-incubation with PTX. c) CRE-SPAP production in CHO-SPAP cells in response to impentamine either alone or in the presence of 4 μM forskolin. Bars show basal CRE-SPAP production, that in response to 4 μM forskolin alone. Data points are mean ± s.e.m. of triplicate values from a single experiment and are representative of a) 5, b) 3 and c) 3 separate experiments.

