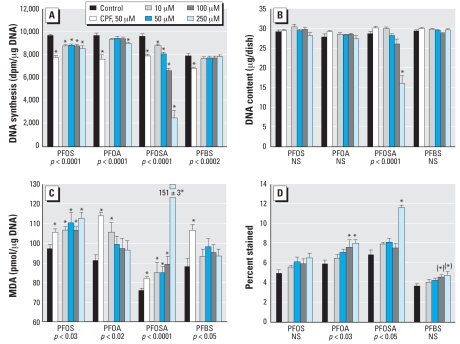
Figure 1.
Effects of perfluorinated chemicals in undifferentiated PC12 cells after 24 hr of exposure. (A) DNA synthesis. (B) DNA content. (C) Lipid peroxidation. (D) Cell viability evaluated with trypan blue. Abbreviations: dpm, disintegrations per minute; NS, not significant. Values shown are mean ± SE of 8–16 determinations for each group. ANOVA across all treatments in a given experiment is shown at the bottom of each panel. In (A, B, and C), 50 μM CPF was included as a positive test compound for comparison with the perfluorinated chemicals; CPF does not decrease viability (Song et al. 1998) and was therefore not included in (D).
*Individual treatments differ significantly from the corresponding control. The asterisks in parentheses for PFBS in (D) denote significant differences that were found in the post hoc test despite the absence of a significant overall effect by ANOVA; this was carried out because two-factor ANOVA (treatment, differentiation state) for trypan blue staining in both the undifferentiated state and during differentiation (Figure 3B) indicated a significant main treatment effect (p < 0.02) without a treatment × state interaction.

