Figure 3.
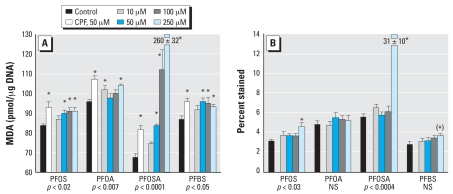
Effects of perfluorinated chemicals on cell damage markers in differentiating PC12 cells after 4 days of exposure. (A) Lipid peroxidation assessed by the MDA concentration. (B) Trypan blue staining of nonviable cells. NS, not significant. Values shown are mean ± SE of 8–16 determinations for each group. ANOVA across all treatments in a given experiment is shown at the bottom of each panel. For comparison with the perfluorinated compounds, 50 μM CPF was included as a positive test compound in (A), but because CPF does not decrease viability (Song et al. 1998), it was not included in (B).
*Individual treatments differ significantly from the corresponding control. The asterisk in parentheses in (B) denotes a significant difference that was found for PFBS in the post hoc test despite the absence of a significant overall effect by ANOVA; this was carried out because two-factor ANOVA (treatment, differentiation state) for trypan blue staining in both the undifferentiated state (Figure 1D) and during differentiation indicated a significant main treatment effect (p < 0.02) without a treatment × state interaction.

