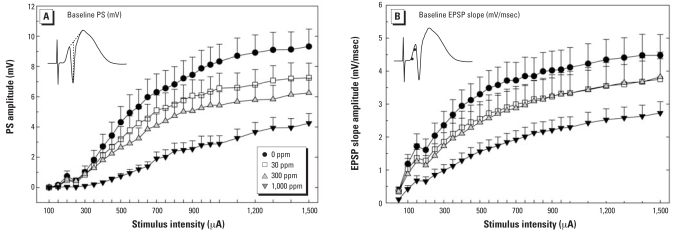
Figure 4.
Amplitudes (mean ± SE) of PS (A) and EPSP slope (B) in the dentate gyrus in adult male rats exposed to perchlorate from GD6 to PND30. The inset in (A) depicts a typical response to a high-intensity pulse and how the PS was scored on each averaged waveform at each intensity for each subject. The inset in (B) depicts a response to a high-intensity pulse and the points on the rising phase of the waveform between which the slope was calculated as an estimate of EPSP amplitude.

