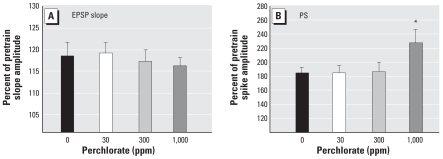
Figure 6.
LTP (mean ± SE) of EPSP slope amplitude (A) and PS amplitude (B) in adult male rats exposed to perchlorate from GD6 to PND30. (A) Probe stimuli recorded before and after LTP-inducing trains of maximal stimulus strength (1,500 μA) increased EPSP slope amplitude, indicating that LTP was successfully induced in all groups to the same degree (p > 0.05). (B) LTP was also induced in the PS, but the magnitude of increase was greater in perchlorate-treated animals from the high-dose group. Note difference in scale between (A) and (B).
*p < 0.05 by Dunnett’s t.

