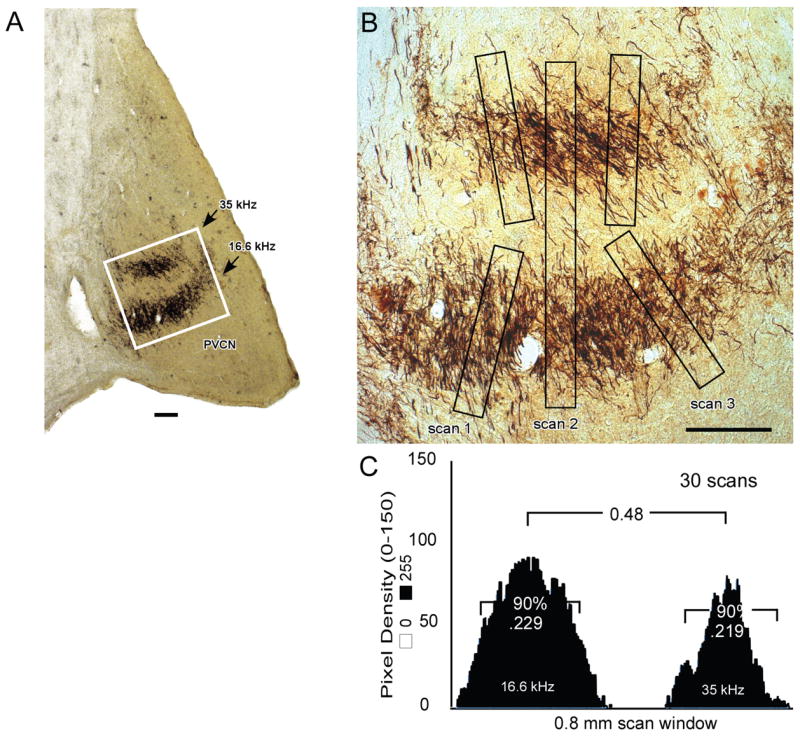
Figure 6.

A,B. CN projection thickness was estimated by determining the mean pixel density in windows of 0.5 mm (25 pixels) by 0.04 mm (200 pixels) with the scan window positioned orthogonal to the projection lamina (e.g., scans 1 and 3 in B). The scans were always executed beginning at the low frequency side of each lamina. In each image, 3 scans were made orthogonal to each projection lamina. The section illustrated is taken from a deafened animal (K169) that was studied at about 8 months of age. Outlined area in A is equal to 1 mm2 and is shown at higher magnification in B. C. For each projection, scans from all sections were averaged. Threshold level was set by subtracting background density until the first negative value occurred in the window. The average plot was normalized, and projection thickness was calculated as the distance containing 90% of the total pixel density. This value was 0.219 mm for the 35 kHz (upper) projection and 0.229 mm for the 16.6 kHz (lower) projection to the PVCN illustrated here. The separation between 2 laminae was determined in a larger scan window of 0.5 mm by 0.8 mm as illustrated by scan 2 in B and measuring the distance between the two maxima in the averaged pixel density plot as shown in C. Scale bars in A and B = 200 μm.
