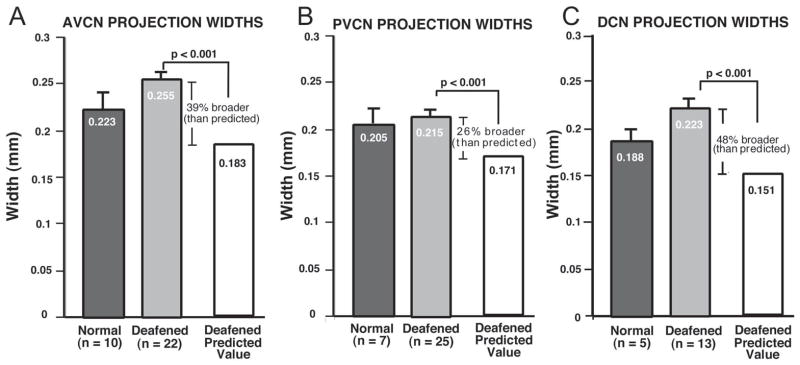
Figure 7.
A. The data for mean thickness of projection laminae in the AVCN are shown, as measured in sections from normal adult controls (black bar) and for all neonatally deafened animals (gray bar). The mean projection thickness in deafened subjects (255 μm) actually was slightly greater than normal (223 μm). Moreover, when the normalized value predicted for the smaller deafened CN was calculated (i.e., if laminae in the deafened CN were precisely proportionate to those in the normal CN), the predicted value was 183 μm. Thus, the AVCN projections in the deafened animals were 39% broader than predicted if they were proportionate to the projections in normal control subjects. B. Data are shown here for the PVCN projections in the same groups. The PVCN projection laminae measured in normal controls had a mean thickness of 205 μm, and the PVCN projection thickness measured in deafened animals was very similar, with an average value of 215 μm. When normalized for the smaller size of the CN in the deafened group, however, the predicted PVCN projection thickness was 171 μm. Thus, the measured PVCN projections thickness in deafened animals was proportionately 26% broader than in normal controls. C. The DCN projection laminae measured in normal controls averaged 188 μm. The absolute mean values for projections in deafened subjects were slightly larger than normal, with an average of 0.223 mm. When normalized for CN size, the expected DCN projection thickness for the deafened group was 0.151 mm. Thus, DCN projections in the deafened animals were 48% broader than projections in controls, when scaled relative to CN size. Note that the absolute values for both the PVCN and DCN projection thickness in deafened subjects were slightly larger than the corresponding values in normal controls, but these differences were not significant. The error bars indicate standard error of the mean.

