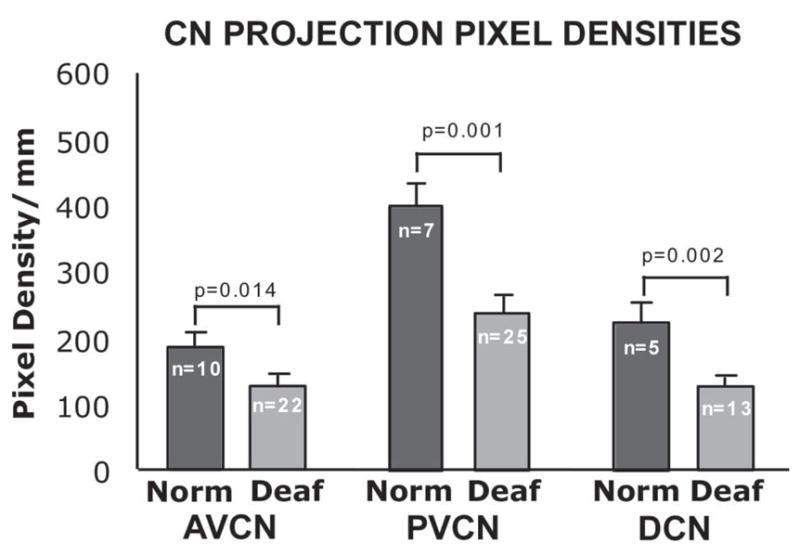
Figure 8.

Average pixel density values for all scans are compared for normal controls and deafened groups in each of the CN subdivisions. In all three subdivisions of the nucleus, AVCN and PVCN and DCN, pixel densities are significantly reduced in the deafened subjects as compared to normal controls. Error bars represent standard error of the mean.
