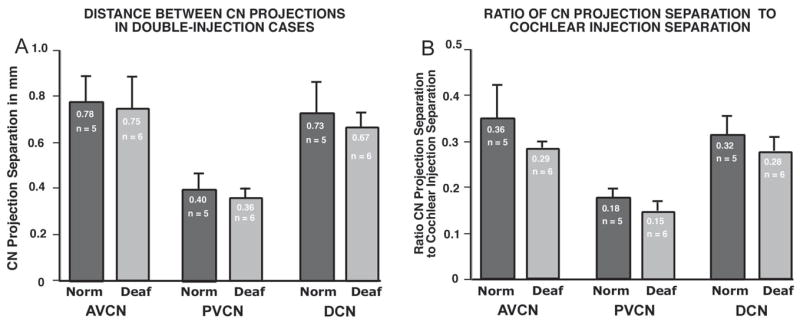
Figure 9.

A. Mean separation distance between CN projection laminae is shown for cases in which two successful injections were made in a single cochlea, and projections to all 3 CN subdivisions were sufficiently intense to be measured. Data shown compare absolute values for separation distances in AVCN, PVCN and DCN in control and neonatally deafened groups. The separation in AVCN and DCN projections was about double that between the corresponding PVCN projections. B. The data from A are normalized for the separation between injection sites by dividing the absolute CN projection separation values by the separation distances for the corresponding cochlear injection sites. When the intersubject variability is taken into account in this manner, the proportionate values were always smaller in the deafened CN. Since the CN laminae in deafened animals are equal in thickness to projections in the normal group, this finding that projections are closer together in the deafened group supports the suggestion that the CN projections from adjacent cochlear sectors must be more overlapping in the deafened group.
