
Fig. 9.
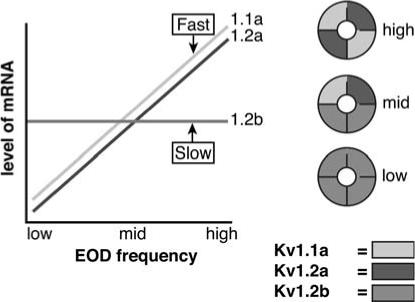
Schematic diagram of the relationship between Kv1 gene expression and EOD frequency in Sternopygus. ‘‘Fast’’ and ‘‘slow’’ refer to the presumed rates of activation of each subunit in a homomer. The colored doughnuts on the right illustrate hypothetical subunit composition of the electrocyte Kv1 channel of fish with high-, mid- and low-frequency EODs in accordance with the relative abundance of the mRNAs of each subunit in fish across the EOD frequency range (P. Few and H. Zakon, unpublished data)