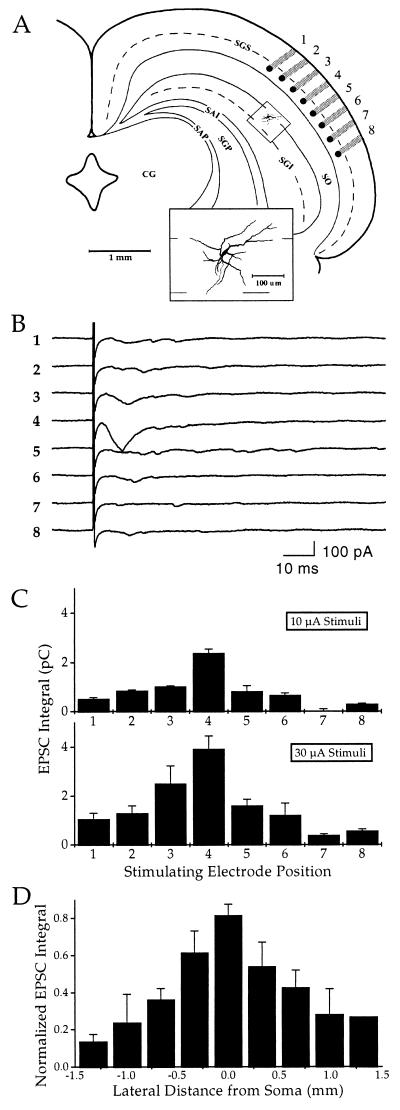
Figure 3.
Spatial tuning of the synaptic responses of premotor cells. (A) Location of a stimulating electrode array in SGS and the upper SGI cell from which the data in B and C were obtained. The cell was located below stimulating electrode 4. (B) EPSCs evoked by electrode 4 were larger than those evoked by other electrodes. (C) Relationship between postsynaptic responses and stimulating electrode position obtained from the cell shown in A at two different stimulus intensities. EPSCs were quantified by measuring their time integral, and the values shown represent the mean and standard error determined from responses to three stimuli. (D) Average spatial tuning characteristics of eight premotor neurons. The abscissa indicates the lateral distances between the cell somata and the long axis of the stimulating electrodes, and the ordinate indicates the mean and standard error of EPSC integrals, which were normalized to the largest responses measured for each cell. For definitions of abbreviations used in A, see the Fig. 1 legend.

