Figure 4.
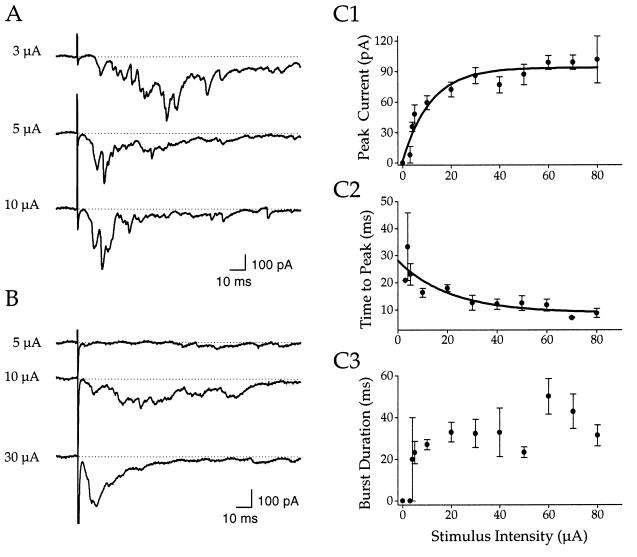
(A and B) Clusters of EPSCs evoked by different stimulus intensities in two cells located in the upper intermediate gray layer. (C) Relationships between the intensity of single stimulus pulses and magnitude (C1), latency (C2), and duration (C3) of evoked bursts of EPSCs. Each point is based on three responses in a single neuron.

