
Figure 5.
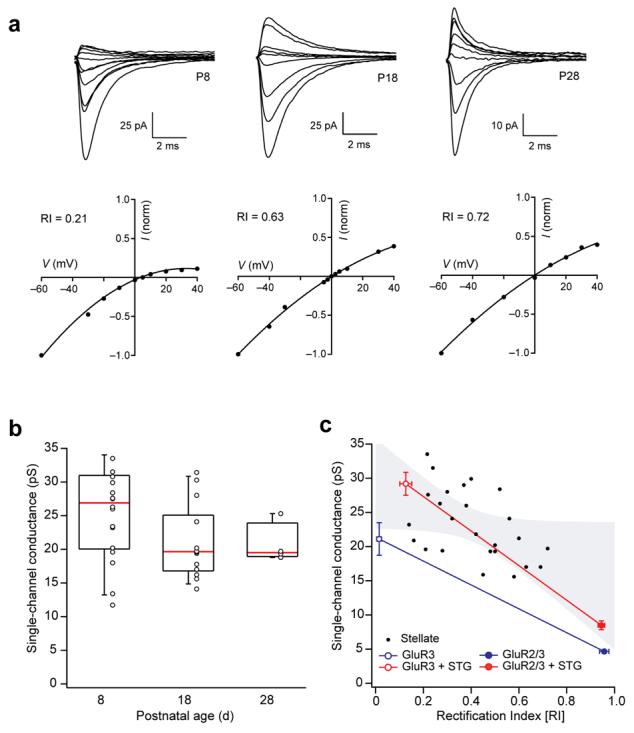
Rectification and conductance properties of synaptic AMPARs are consistent with the presence of stargazin. (a) Top, representative stellate cell EPSCs evoked by parallel fiber stimulation at three different ages (P8, 18 and 28). Bottom, corresponding peak I-V relationship. RI denotes the rectification index (Methods). (b) Plot of single-channel conductance for AMPARs determined from spontaneous EPSCs at three different ages. Values from individual cells are shown with box-and-whisker plots (indicating median, 25-75th and 10-90th percentiles). (c) Scatter plot of rectification index for stellate cell-evoked EPSCs against single-channel conductance determined from psNSFA of spontaneous EPSCs in the same cells. Filled circles represent individual cells; gray shading indicates the 99% confidence limits of a linear fit to the data (n = 23; P=0.023 by Spearman rank-order correlation; fit removed for clarity). Superimposed on this graph are corresponding data from two sets of recombinant receptors (GluR3 and GluR2/GluR3) with and without stargazin. Symbols indicate mean, and vertical and horizontal error bars denote s.e.m. for each condition. Note that only receptors with stargazin mimic the properties of the synaptic receptors.