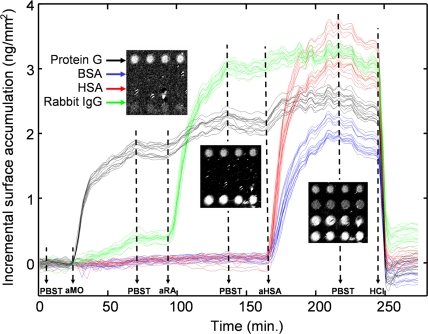
Fig. 3.
Dynamic binding kinetics of different antigens to their antibodies. Kinetics of 64 spots are plotted. The noise floor is 26 pm per spot. Sixteen of the spots are shown at different stages of the experiment as Insets. Solutions are introduced as indicated on the timeline: (PBST) PBS buffer with Tween 20, (aMO) goat anti-mouse IgG, (aRA) goat anti-rabbit IgG, (aHSA) rabbit anti-HSA, (HCl) 20 mM hydrochloric acid. A movie of the binding events is available (Movie S1). Fluctuations on the plots, between the 170th min and 250th min in the timeline, are caused by the laser intensity noises and can be reduced by adjustments and improvements in the optical setup.

