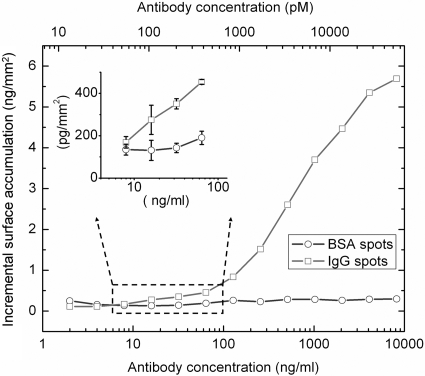
Fig. 4.
Dilution curve for antibody–antigen interaction. Dilution curves for a pair of IgG–BSA spots are plotted. The sample was incubated in the solutions with increasing concentrations of antibody, each for 45 min., and imaged by SRIB. The antibody concentrations are shown for two different units: nanograms per milliliter and picomoles. Molarity was calculated by assuming the molecular mass of the antibody is 150 kDa. A concentration of 19 ng/ml is clearly detectable for an individual spot, corresponding to ≈120 pM, with a confidence limit of 95%. Because the error bars are very small compared with the height scale of the main plot, a portion of the curve is blown up. The error bars correspond to the standard deviation of measured height of each spot in five consecutive measurements.

