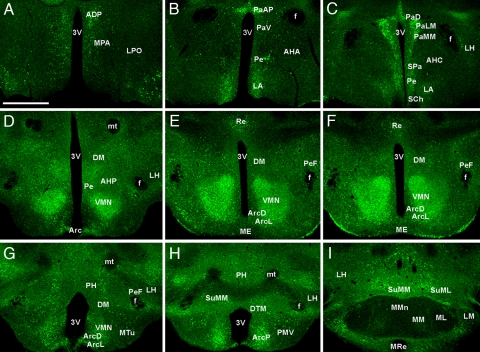
Fig. 2.
EGFP expression in the hypothalamus of Tg(Kcnj5-EGFP)49Gsat mice. A series (rostral-to-caudal) of coronal sections (15 μm) through the hypothalamus from an adult male Tg(Kcnj5-EGFP)49sat mouse. Images are representative of those taken from three different Tg(Kcnj5-EGFP)49sat mice. Abbreviations are defined in Table 2. (Scale bar: 600 μm.)

