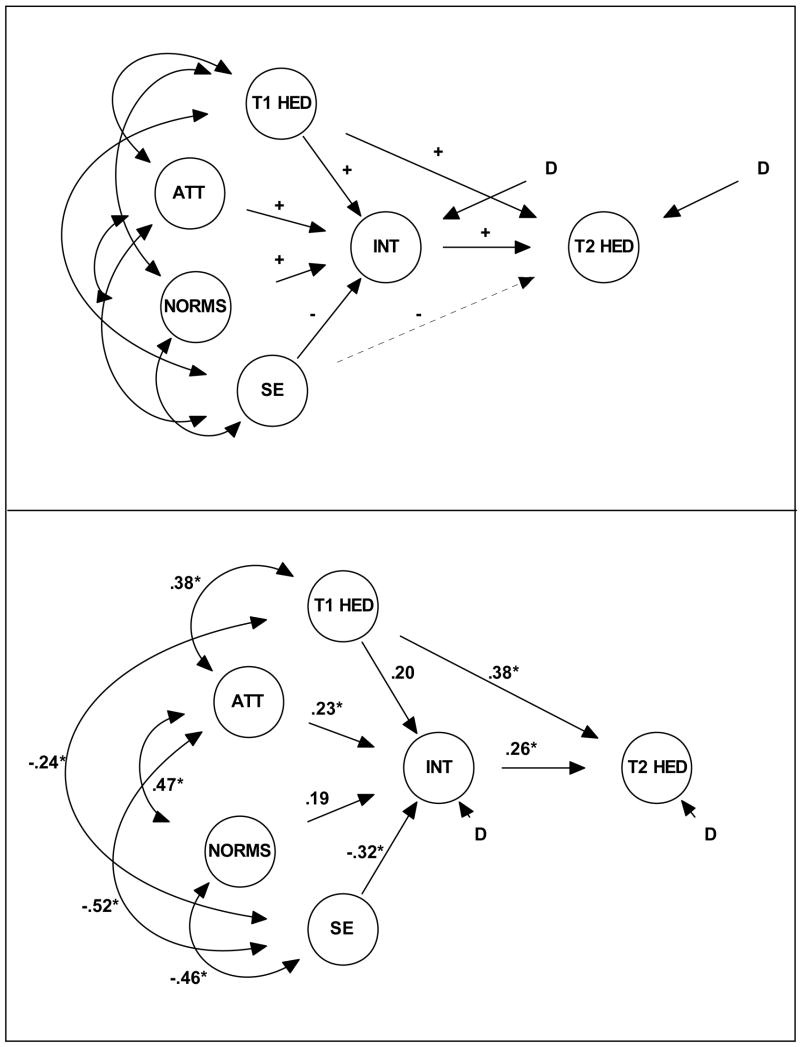
Figure 1.
Top panel: Hypothesized model including time 1 drinking. + = hypothesized positive association. − = hypothesized negative association. D = disturbance (unexplained variance in endogenous latent factors). T1 HED = time 1 heavy episodic drinking. ATT = time 1 attitudes. NORMS = time 1 subjective norms. SE = time 1 self-efficacy. T2 HED = time 2 heavy episodic drinking. Double-headed arrows imply nondirectional covariance between the variables. The dotted line represents the nested model including a direct effect for SE on T2 HED. For ease of interpretation, measured indicators are not shown. Bottom panel: Final model including time 1 drinking. * = significance at the .05 level.

