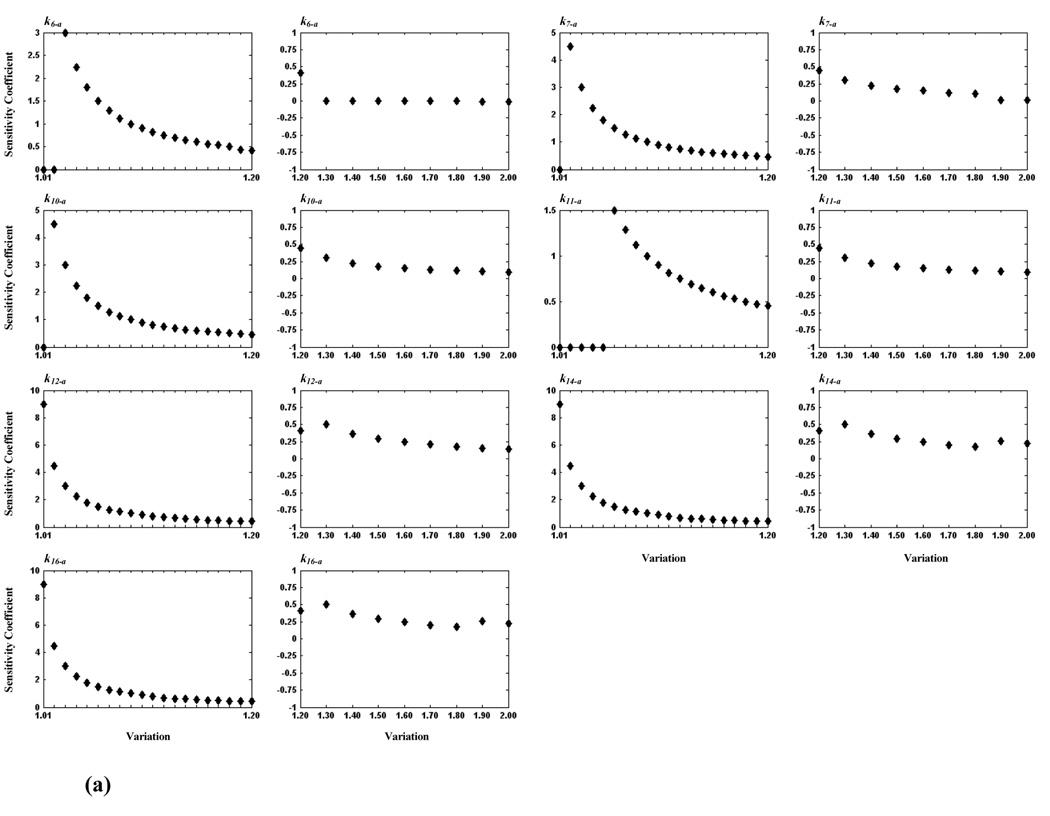
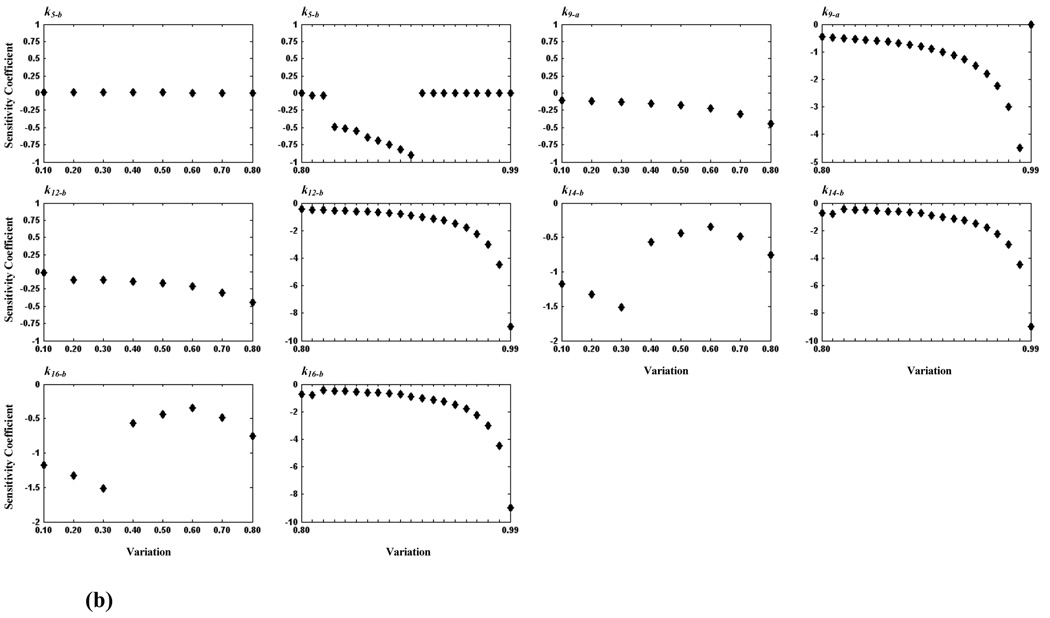
Figure 5.
Plots of sensitivity coefficients for sensitive rate constants. In (a), seven rate constants are shown for which the critical area is between 1.0- and 2.0-fold; their values varied from 1.0- to 1.2-fold by an incremental increase of 0.01 (first and third columns) and from 1.2- to 2.0-fold by an incremental increase of 0.1 (second and fourth columns). In (b), five rate constants are shown for which the critical area is between 0.1 and 1.0; their values varied from 0.1- to 0.8-fold by an incremental increase of 0.1 (first and third columns) and from 0.8- to 1.0-fold by an incremental increase of 0.01 (second and fourth columns).


