
FIG. 8.
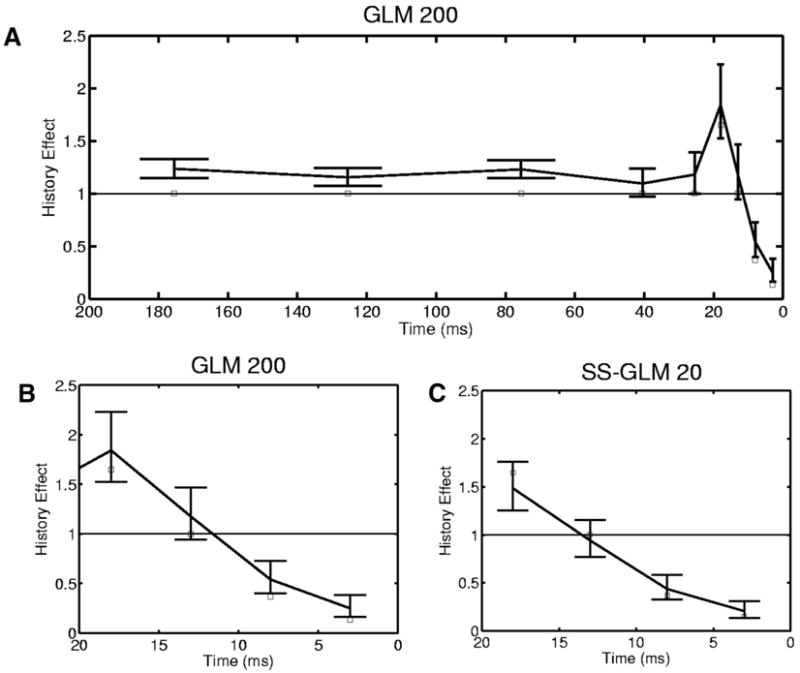
Spike-history component (Eq. 15) for the simulated neural spiking activity (Fig. 3) estimated from the GLM 200 (A) and the SS-GLM 20 (C) models along with 95% confidence intervals (bars) and the true values of spike-history component (open squares). B: the first 5 coefficients (20 ms) of the spike-history component of the GLM 200 model plotted for better comparison with the SS-GLM 20 coefficients. The spike-history component of the SS-GLM 200 model was estimated with time bins of 1–5, 6 –10, 11–15, 16 –20, 21–50, 51–100, 101–150, and 151–200 ms. The spike-history component of the SS-GLM 20 model was estimated with time bins of 1–5, 6 –10, 11–15 and 16 –20 ms.