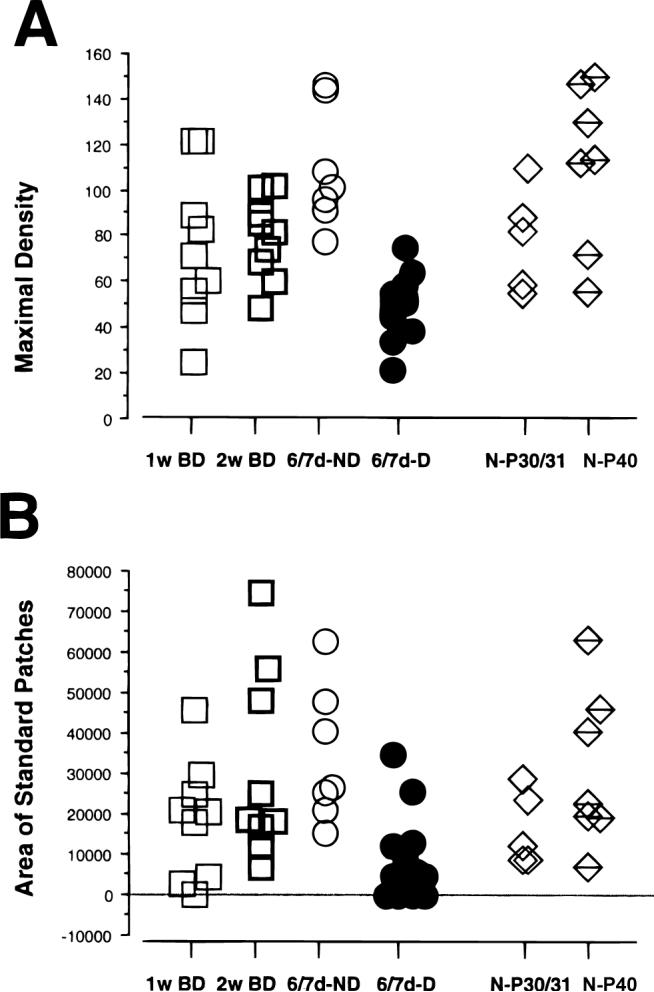
Fig. 5.

Density analysis of the terminal arborization in layer IV expressed as μm/1000 μm2. (A) Scattergram of the maximal density of arbors reconstructed from 1-week and 2-week binocularly deprived animals, of arbors serving the deprived (D) and nondeprived (ND) eye in 6/7dD animals, and of arbors reconstructed in normal animals at P30/31 and P40. (B) Scattergram of the cumulative area of the standard patches (see Results) of the terminal arborizations in all groups of animals. Note that the values for one arbor in 1-week BD group and four deprived arbors in 6/7dD are equal to 0, as they did not reach the threshold density of 38 μm/1000 μm2.
