
Figure 2.
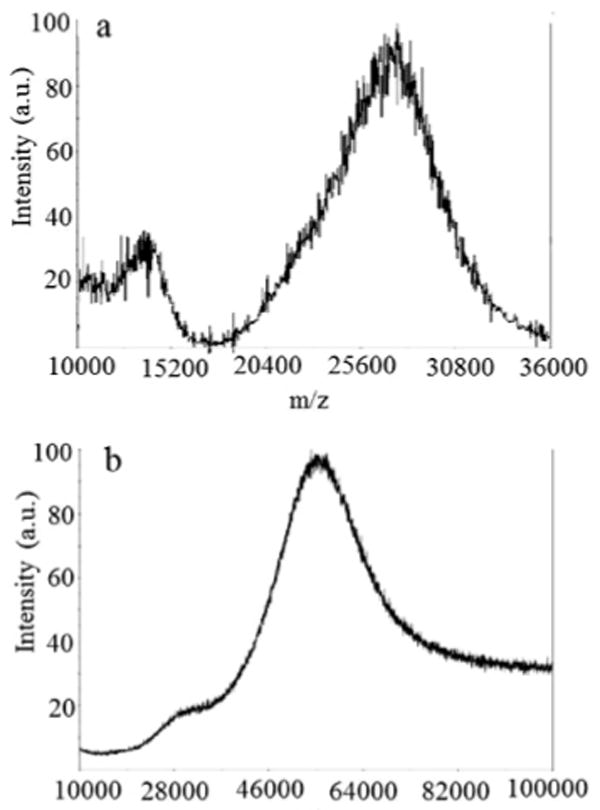
MALDI-TOF mass spectra of the G5 PAMAM (a) and PEG–PAMAM (b), showing their average MWs to be 26 575 and 55 249 Da. The peak at ∼13 290 (a) and the shoulder at ∼27 600 Da/charge (b) are likely from the double-charged molecular ions.
Official websites use .gov
A
.gov website belongs to an official
government organization in the United States.
Secure .gov websites use HTTPS
A lock (
) or https:// means you've safely
connected to the .gov website. Share sensitive
information only on official, secure websites.
MALDI-TOF mass spectra of the G5 PAMAM (a) and PEG–PAMAM (b), showing their average MWs to be 26 575 and 55 249 Da. The peak at ∼13 290 (a) and the shoulder at ∼27 600 Da/charge (b) are likely from the double-charged molecular ions.