
Figure 3.
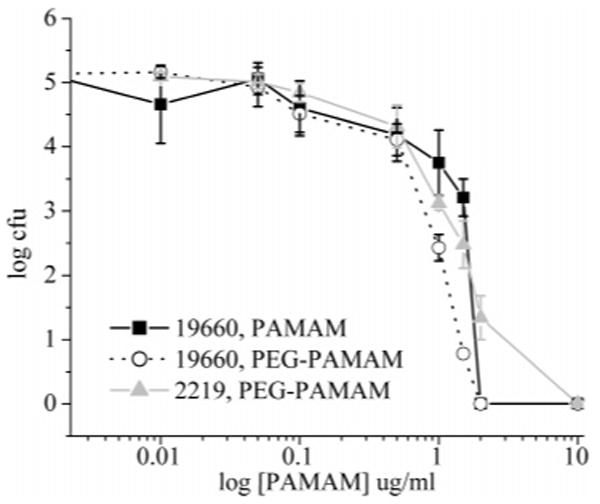
Concentration (cfu/mL) of PA, including PA19960 (lab strain) and PA2219 (clinical strain), upon incubation with PAMAM and PEG–PAMAM at various concentrations for 2 h. The data points are the mean of at least three separate experiments, and the error bar represents the standard deviation.