
Figure 4.
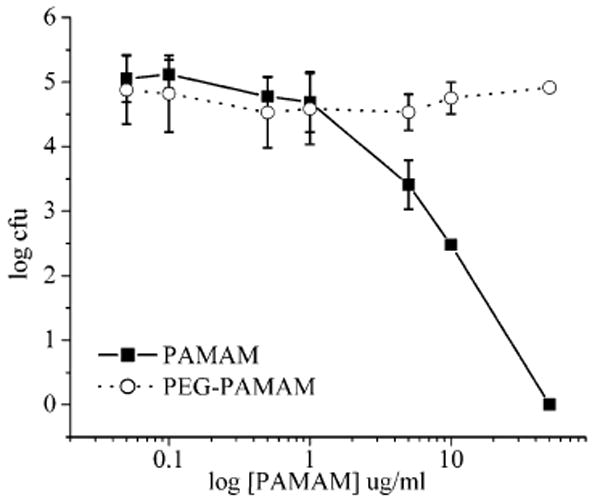
Concentration (cfu/mL) of bacteria SA ATCC 29213 upon incubation with G5 PAMAM and 43% PEG-coated PAMAM (PEG–PAMAM) at various concentrations for 2 h. The data points are the mean of at least three separate experiments, and the error bar represents the standard deviation.