
Figure 2.
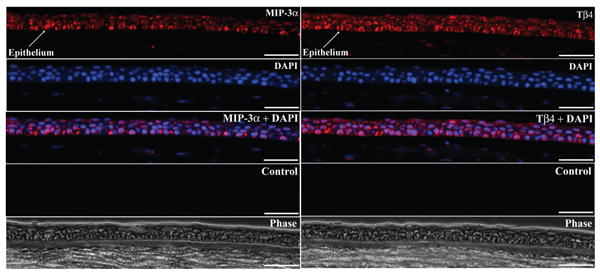
Immunostaining of MIP-3α and Tβ4 in the cornea. The figure shows representative images for MIP-3α (left) and Tβ4 (right) expression in normal human corneal epithelium (sections from central cornea). Specific immunolabeling for MIP-3α or Tβ4 is shown in red; DAPI: nuclear labeling (blue); MIP-3α or Tβ4+ DAPI: merged image; control: background labeling in the absence of primary antibody; phase: phase contrast image. Identical findings were seen in corneas from three different donors. (Scale bars: 40 μm).