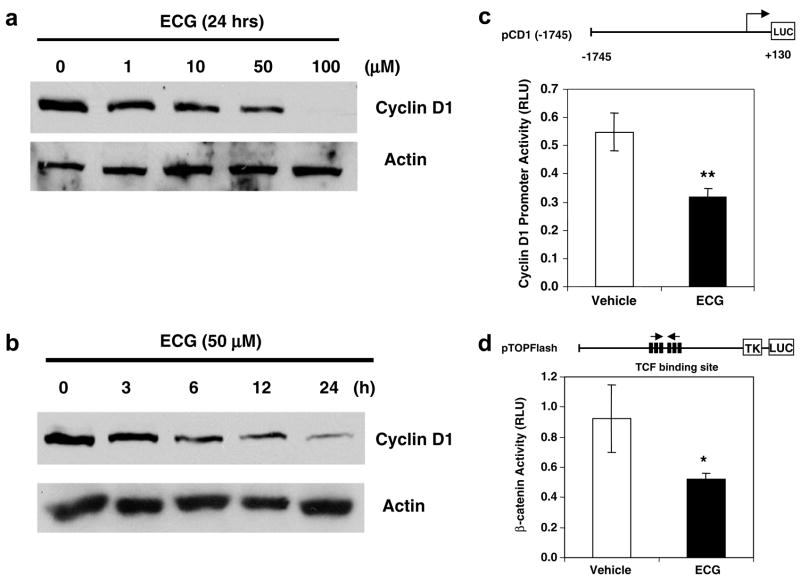
Fig. 3.
Inhibition of cyclin D1 expression and β-catenin signaling in ECG-treated SCC7 cells. (a) Dose response of cyclin D1 expression. SCC7 cells were grown in different concentrations of ECG for 24 h, and Western blot analysis was performed. Thirty microgram of total proteins was loaded in each lane and transferred onto a nitrocellulose membrane. The blot was hybridized with cyclin D1 antibody and re-probed with actin antibody. (b) Western blot analysis of cyclin D1 expression by ECG. SCC7 cells were treated with 50 μM ECG for various time points. Western analysis was performed as described above. (c) Cyclin D1 promoter construct (1.6 μg) containing −1745 to +130 of human cyclin D1 promoter region29 was co-transfected into SCC7 cells with pRL-null control vector (0.1 μg) using Lipofectamine™2000, and luciferase activity was measured. Values are expressed as means ± SD of 3 replicates. **P < 0.01 versus vehicle treated samples. (d) TOP Flash constructs containing six copies of TCF binding site (1.6 μg) were co-transfected into SCC7 cells with pRL-null control vector (0.1 μg) using Lipofectamine™2000, and luciferase activity was measured. Values are expressed as means ± SD of 3 replicates. *P < 0.05 versus vehicle treated samples.

