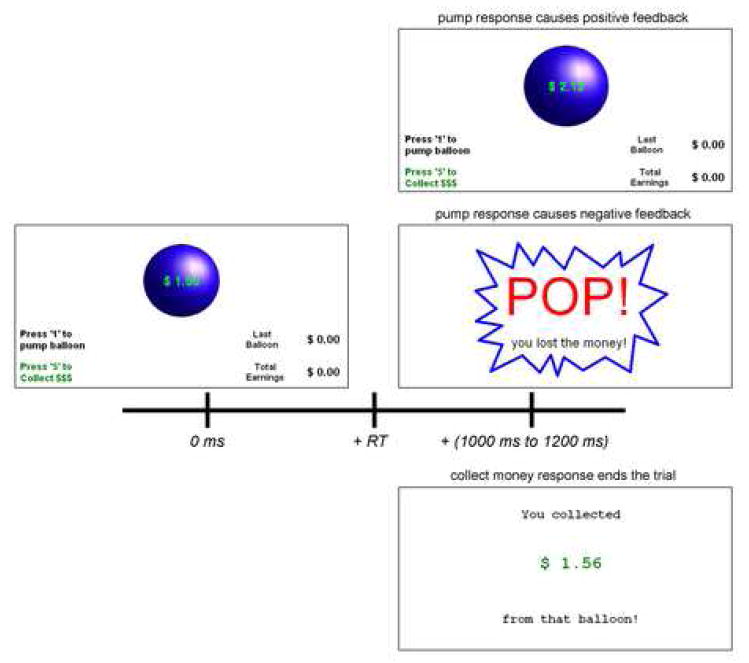
Figure 1.

Example stimulus-response-feedback timeline for the BART. Upon balloon presentation, the participant can choose to end the trial and collect money from the balloon (bottom right) or he can choose to pump the balloon again. If he chooses to pump the balloon, negative feedback may appear in the form of a balloon burst (middle right) or positive feedback may appear in the form of a larger balloon with more money (top right). All feedback stimuli are presented after a random delay (1 to 1.2 ms) after a response is made.
