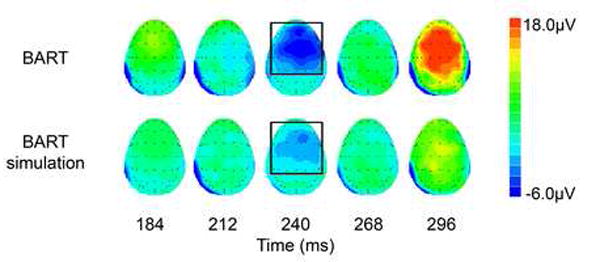
Figure 3.

Scalp topography of difference waves (negative feedback minus positive feedback) by task at 28ms snapshots. The feedback ERN (denoted by bounding boxes) is visible 240ms after the onset of negative feedback. Spatial distribution of the feedback ERN is similar in both tasks, but stronger and more widespread during the BART.
