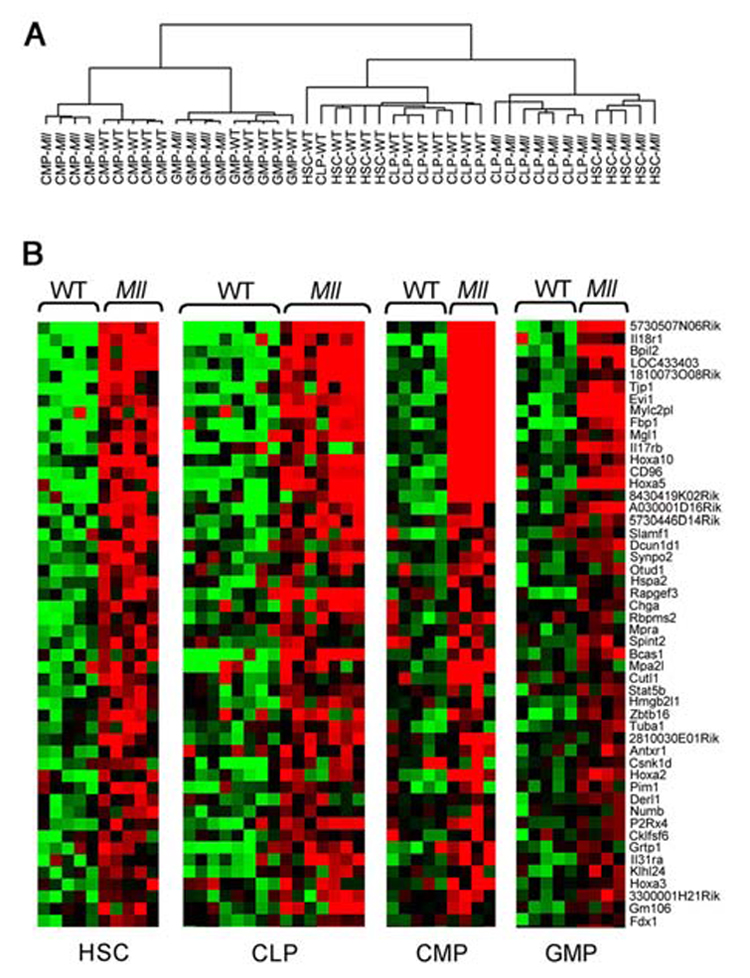
Figure 4. Hierarchical clustering of Mll-AF9 LSK (HSC/CLP), and CMP/GMP populations. Genes overexpressed in HSC, CLP, CMP and GMP populations.

a, A two-way ANOVA with stratified permutation testing was performed to select genes differentially expressed in Mll-AF9 compared to wild type cells in each of the four populations. Hierarchical clustering performed with the 446 genes selected by the two-way ANOVA (FDR<0.1) separates the HSCs/CLPs from the CMPs/GMPs. WT = wild type, Mll=Mll-AF9. b, Mll-AF9 up-regulates expression of genes in multiple cell types (FDR<0.1, two-way ANOVA with permutation testing). Heat-maps showing the expression level of the top 50 genes up-regulated in the Mll-AF9 samples compared to WT, ranked in decreasing order of fold change up-regulation in HSCs. Expression levels are represented by colors: black=median red > median, green < median. Gene identifiers are at right.
