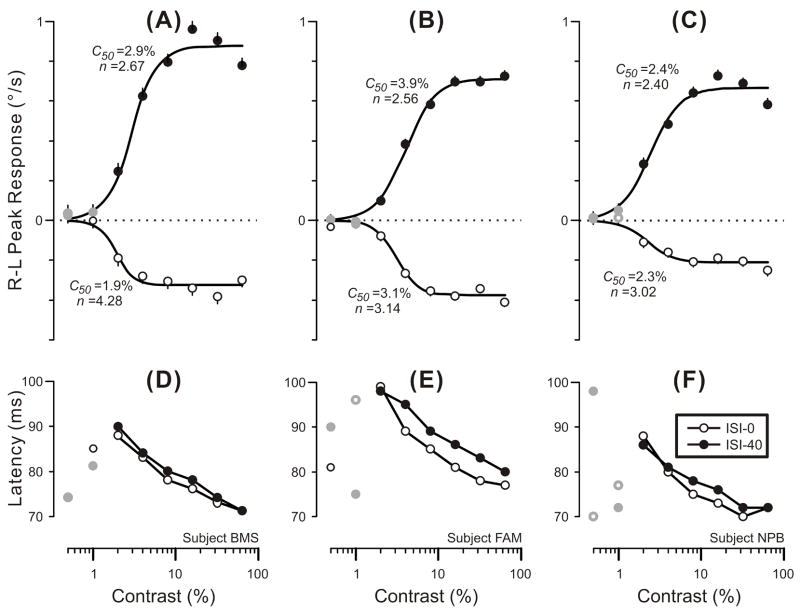
Fig. 4.
The initial horizontal OFRs elicited by two-image movies applied to vertical 3f gratings with an ISI of 0 ms or 40 ms: dependence of mean R-L peak velocity (upper plots) and latency of the R-L peak (lower plots) on contrast (data for each of 3 subjects). Positive peak responses denote tracking in the direction of the applied 1.65º steps and the smooth black curves are best-fit Naka-Rushton functions (Expression 1) with the values of their c50 and n parameters shown nearby (error bars, SEs). Peak latencies were measured from the appearance of the 2nd frame using the mean R-L eye velocity traces (so there are no error bars). Open circles: 0-ms ISI. Closed circles: 40–ms ISI. Gray symbols: 10/48 responses that failed to exceed 3 SDs and were selected by hand. A,D: subject BMS (143–154 trials per condition; SDs ranged from 0.42–0.50º/s). B,E: subject FAM (282–303 trials per condition; SDs ranged from 0.37–0.45º/s). C,F: subject NPB (189–201 trials per condition; SDs ranged from 0.37–0.43º/s). Error bars, SE’s.

