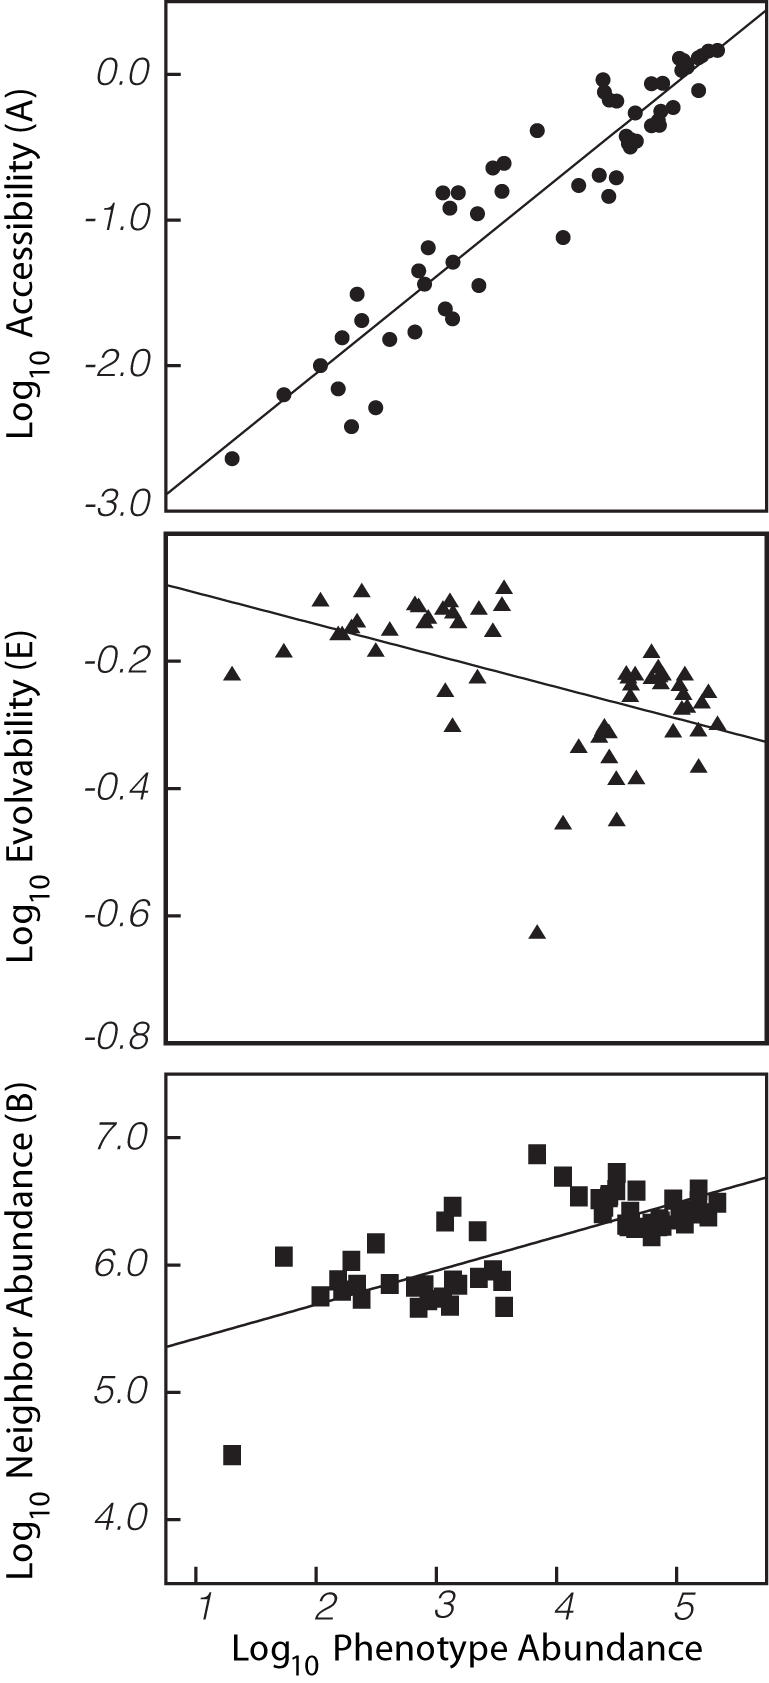
Figure 4. Mutational connectivity among RNA phenotypes.

(Top) The Astatistic (described in text) indicates the likelihood that a given phenotype will arise through point mutation. Random mutations are more likely to hit upon larger neutral networks that smaller neutral networks (r 2 = 0.886, P<2.2×10⁻¹⁶; calculated on log-transformed data). (Middle) The E statistic (described in text) indicates the likelihood of given phenotype will produce diverse alternative phenotypes upon mutation. Point mutations to sequences in large neutral networks are less likely to yield novelty than point mutations to sequences in small neutral networks (r 2 = 0.265, P = 3.56×10⁻⁵). (Bottom) The B statistic (described in text) suggests that point mutations to abundant phenotypes create other abundant phenotypes (r 2 = 0.559, P = 1.58×10⁻¹¹).
