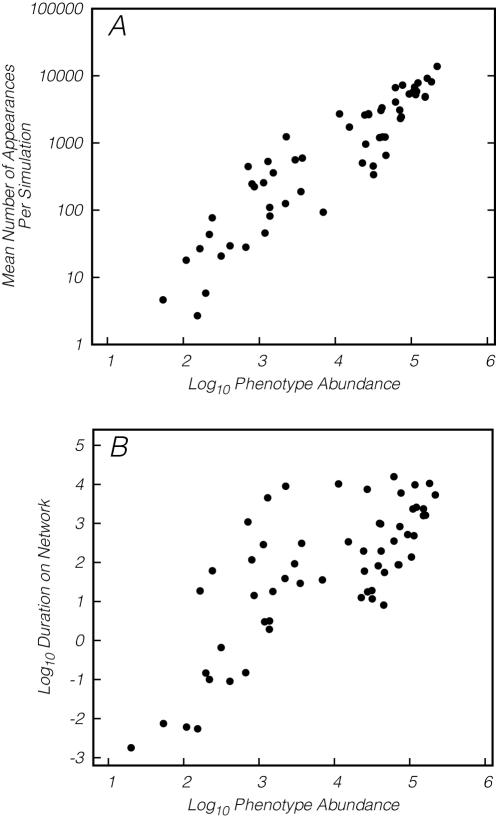
Figure 7. Populations exploring the 12-mer fitness landscape.
(A) The number of appearances of a phenotype is strongly correlated with the abundance of that phenotype (r = 0.92, P = 2.2×10⁻¹⁶, calculated on logtransformed data). (B) The total number of time steps that a phenotype occurs in the evolving populations is positively correlated with its abundance (r = 0.75, P = 1.5×10⁻¹¹, calculated on logtransformed data).

